V5.20.14 early access build

Status
Not open for further replies.

KSTR

New Member
Joined
Jun 7, 2019
Messages
49
@John Mulcahy ,
V5.20.14ea15 raises "array index out of bounds" exception when importing (or dropping) a WAV into the RTA with a FFT size larger than the sample count in the file.

Suggestions for possible fixes:
- zero padding to end of FFT
- zero padding at start of FFT
- zero padding symmetrically at start & end of FFT (probably the most sensible option)
- repeat samples (another option that would make sense at times)
It's a low priority issue, so no worries ;-)
Code:
REW V5.20.14 running Azul Systems, Inc. JRE 1.8.0_352 64-bit on linux 5.4.0-135-generic Locale: language en, keyboard US, UTF-8 at 96 DPI
 

Message:
    java.lang.ArrayIndexOutOfBoundsException: 0
Stack Trace:
0
    roomeqwizard.MeasData.findMinMax(y:5025)
    roomeqwizard.EB.A(y:1265)
    roomeqwizard.PC$10.run(y:2330)
    java.awt.event.InvocationEvent.dispatch(InvocationEvent.java:311)
    java.awt.EventQueue.dispatchEventImpl(EventQueue.java:758)
    java.awt.EventQueue.access$500(EventQueue.java:97)
    java.awt.EventQueue$3.run(EventQueue.java:709)
    java.awt.EventQueue$3.run(EventQueue.java:703)
    java.security.AccessController.doPrivileged(Native Method)
    java.security.ProtectionDomain$JavaSecurityAccessImpl.doIntersectionPrivilege(ProtectionDomain.java:74)
    java.awt.EventQueue.dispatchEvent(EventQueue.java:728)
    java.awt.EventDispatchThread.pumpOneEventForFilters(EventDispatchThread.java:205)
    java.awt.EventDispatchThread.pumpEventsForFilter(EventDispatchThread.java:116)
    java.awt.EventDispatchThread.pumpEventsForHierarchy(EventDispatchThread.java:105)
    java.awt.EventDispatchThread.pumpEvents(EventDispatchThread.java:101)
    java.awt.EventDispatchThread.pumpEvents(EventDispatchThread.java:93)
    java.awt.EventDispatchThread.run(EventDispatchThread.java:82)
 

John Mulcahy

REW Author
Thread Starter
Joined
Apr 3, 2017
Messages
7,337
how feasible would it be to include an option to reference another measurement's group delay as an overlay within this GD window? Also it would be fantastic if we could put another window in there that shows the step response (also with the ability to show overlays).
Overlays would be problematic, those graphs are designed to show data from a single measurement. I can add step responses to the Impulse graph, I'll do that for the next build. All the predicted responses update when filtering is changed, 200 ms after you stop altering values.
 

moedra

Member
Joined
Mar 1, 2021
Messages
66
Overlays would be problematic, those graphs are designed to show data from a single measurement. I can add step responses to the Impulse graph, I'll do that for the next build. All the predicted responses update when filtering is changed, 200 ms after you stop altering values.
Alright cool. Having the step in there would be very nice.
Now, if we can't put an overlay in the EQ window, is there a way to make the active measurement in the overlays window itself update in real time without having to generate a new measurement from predicted every time I make a change to the EQ? This would also speed things up a lot and reduce "measurement overload" confusion, which sometimes happens from all the new measurements that are generated going back and forth between the EQ filters window, EQ window, the main interface, and the overlay window...
 

John Mulcahy

REW Author
Thread Starter
Joined
Apr 3, 2017
Messages
7,337
V5.20.14ea15 raises "array index out of bounds" exception when importing (or dropping) a WAV into the RTA with a FFT size larger than the sample count in the file.
I have fixed it for the next build, files that are too short will be rejected with a message explaining why.
 

John Mulcahy

REW Author
Thread Starter
Joined
Apr 3, 2017
Messages
7,337
Now, if we can't put an overlay in the EQ window, is there a way to make the active measurement in the overlays window itself update in real time without having to generate a new measurement from predicted every time I make a change to the EQ?
Why would the measurement update? It hasn't changed. All the predicted traces generated from it (Predicted SPL, Predicted phase and all the predicted traces in the graphs on the EQ window) update whenever there is any change to the filter settings.
 

moedra

Member
Joined
Mar 1, 2021
Messages
66
Why would the measurement update? It hasn't changed. All the predicted traces generated from it (Predicted SPL, Predicted phase and all the predicted traces in the graphs on the EQ window) update whenever there is any change to the filter settings.
What I'm referring to is how the group delay now updates in the EQ window as I make changes to the EQ filter bands. I can see what the results of the EQ changes are as I make them without having to "generate measurement from predicted" and then go to another window (like the overlays window) to see how the updated adjustment to the EQ has affected the group delay. This is awesome and I love being able to see the group delay update in real time like that. It can save a lot of time.

However, the way I optimize the EQ filters is such that I am making adjustments to align the group delays (and subsequently the step responses) between two measurements. Hence the need for an overlay. Since there is no overlay in the EQ window, I need to generate new measurement from predicted and then go back to the overlays window to see the changes compared to the other measurement. It works, it's just time-consuming and tedious because it has to be done repeatedly until the delays are aligned (below 200Hz).

If the overlays window had a "preview mode" that would update itself as I make changes to the filter bands (the way the EQ window now does), I wouldn't have to generate new measurements every time I change a filter band. An overlay in the EQ window (something like a referenced measurement) would also work to the same extent.

I'm sorry if this isn't clear... I might have to make a short video showing the process.
 

John Mulcahy

REW Author
Thread Starter
Joined
Apr 3, 2017
Messages
7,337
I have a relatively easier to implement suggestion: Can we add "Fit to data for current freq. range" option to "Fit to data"? The inaudible bass area always squeezes the part we would like to see in higher detail.

20-2000 can easily be selected from the bottom right corner and a button to fit the SPL to that range for example would accelerate the work flow IMO.
I'll add a Ctrl+Alt+Y shortcut for that, but implementing it for all graph types would be a lot of work so I'll just do it for the main graphs that have a frequency axis.
 

John Mulcahy

REW Author
Thread Starter
Joined
Apr 3, 2017
Messages
7,337
However, the way I optimize the EQ filters is such that I am making adjustments to align the group delays (and subsequently the step responses) between two measurements.
As a crude method use the Alt key shortcuts to toggle between the measurements. Alt + up arrow/down arrow if they are adjacent, Alt + number if they are within the first 9 measurements. You can drag measurements in the measurements list to change their position.
 

serko70

Member
Joined
Oct 13, 2017
Messages
239
Location
Germany
More  
Preamp, Processor or Receiver
Marantz SR6015
Main Amp
Rotel Michi X3
Computer Audio
Intel NUC
DAC
Oppo 205
Universal / Blu-ray / CD Player
Oppo 205
Front Speakers
Focal Kanta 2
Center Channel Speaker
Linn
Surround Speakers
Focal Dome Flax
Surround Back Speakers
Focal Dome Flax
Front Height Speakers
Focal Dome Flax
Rear Height Speakers
Focal Dome Flax
Subwoofers
Focal Air
Video Display Device
LG 65 3D OLED
Streaming Subscriptions
TIDAL, ROON
I'll add a Ctrl+Alt+Y shortcut for that, but implementing it for all graph types would be a lot of work so I'll just do it for the main graphs that have a frequency axis.
Great, thanks!
 

ApolloXXVI

New Member
Joined
Oct 29, 2022
Messages
23
Location
Bay Area, California
More  
Main Amp
Bel Canto REF 600M
DAC
Holo Audio May
Front Speakers
Focal Sopra No 3
Streaming Equipment
Grimm Audio MU1
I am in version 5.20.14ea15.
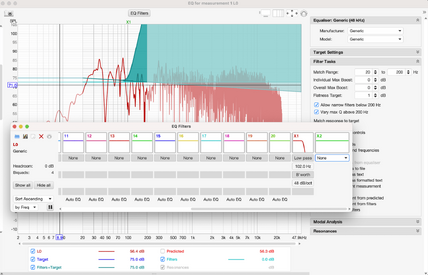
Looks like there is a bug in the graphing of Low pass filter (in EQ Filters), where the graph shows a mirror image of what the Low pass filter should do... The generated measurements from the Low pass filter seem correct though.
 

Attachments

  • Screenshot 2022-12-30 at 4.39.17 PM.png
    Screenshot 2022-12-30 at 4.39.17 PM.png
    138.7 KB · Views: 12

moedra

Member
Joined
Mar 1, 2021
Messages
66
As a crude method use the Alt key shortcuts to toggle between the measurements. Alt + up arrow/down arrow if they are adjacent, Alt + number if they are within the first 9 measurements. You can drag measurements in the measurements list to change their position.
Ah, that can work. Crude yes, but I wasn't aware of those shortcuts. Thanks!
 

pklose

Member
Joined
Jan 11, 2020
Messages
67
wow, the new GUI looks great. No glitches in my (relatively short testing)!

One thing that came to my attention though: Using REW 5.20.14 on macOS 13.0.1: When I hit SAVE ALL, the filename panel includes a complete file path, which leads to an error ("the filename is invalid, only alphanumeric characters, - and _ are permitted"). When using just meta + S though, everything works as expected.
 

John Mulcahy

REW Author
Thread Starter
Joined
Apr 3, 2017
Messages
7,337
One thing that came to my attention though: Using REW 5.20.14 on macOS 13.0.1: When I hit SAVE ALL, the filename panel includes a complete file path, which leads to an error ("the filename is invalid, only alphanumeric characters, - and _ are permitted"). When using just meta + S though, everything works as expected.
I guess you have the View preference to "Use macOS file dialogs" selected. I have fixed that for the next build, you might also want to try the Java file chooser, it has been improved for the new builds.
 

tjcinnamon

Member
Joined
Dec 6, 2020
Messages
123
not sure if this is a result of the new build or not but my delays are coming up all as near zero or slightly negative. I'm using Ch3 (the center channel) as my acoustic timing reference.
 

Attachments

  • spl matching.mdat
    16.9 MB · Views: 23

John Mulcahy

REW Author
Thread Starter
Joined
Apr 3, 2017
Messages
7,337
The centre has a big reflection, larger than the direct sound, so it isn't a good choice of reference. Left or right are cleaner.

1672689044973.png


Channels 5 and 6 have outputs larger than the direct sound about 13 ms later.

1672689155786.png


Ch 7 also has a reflection stronger than the direct sound.

1672689194355.png
 

tjcinnamon

Member
Joined
Dec 6, 2020
Messages
123
The centre has a big reflection, larger than the direct sound, so it isn't a good choice of reference. Left or right are cleaner.

View attachment 58201

Channels 5 and 6 have outputs larger than the direct sound about 13 ms later.

View attachment 58202

Ch 7 also has a reflection stronger than the direct sound.

View attachment 58203
Any idea how I can fix that? Also, I tried it on 5.20.13 (stable) as well and got the same results. I created a new thread because it's unrelated to the new build.


John Mulcahy

REW Author
Thread Starter
Joined
Apr 3, 2017
Messages
7,337
The builds have been updated today with the changes below. These should be the final additions to functionality, the focus will now move to fixing any issues found and then to release. Since so much has changed since 5.20.13 I'll end up releasing this as 5.21, likely with at least one 5.21 beta build ahead of the final release.

  • Added: The alignment tool has a choice of phase or impulse alignment modes. Impulse alignment mode uses cross-correlation of 1/3 octave zero phase filtered impulse responses, results should generally be very close to those using phase alignment but the impulse alignment ignores polarity, so it may find an alignment with a lower delay that requires a polarity inversion. That will be obvious from the filtered impulse graphs, since they will have opposite polarity.
  • Added: Impulse response window presets can now be generated and accessed through the IR windows dialog. Selecting a preset applies it to the currently selected measurement, something to bear in mind if the preset window is left open while switching between measurements.
  • Added: The IR windows dialog now has buttons to apply the window selections to the measurements selected in the All SPL or Impulse overlay graphs
  • Added: The EQ window impulse graph can show step responses
  • Added: Export impulse as wav has an option to place t=0 at a specified sample index, default is 256
  • Added: Analysis preferences has an option to place t=0 for imported IRs at sample 256, so exports/imports with t=0 at sample index 256 will preserve t=0 timing
  • Added: Trace arithmetic has an operation to divide the magnitudes of the traces
  • Added: Trace arithmetic operations to invert magnitude (zero phase) and phase are now included, both can be restricted to a specified frequency range. Those might be used to generate responses for use in convolvers.
  • Added: View preferences default trace colours panel has a button to set the original V5.20 default colours
  • Added: There is a Fit Y to data button on the extents dialog and a Ctrl+Alt+Y shortcut to fit Y axis to data on graphs with a frequency X axis
  • Added: There is an ALL SPL measurement action to make a copy of a response with an IR that is the smallest power of 2 that coves the windowed span
  • Added: Comments and headers can be omitted when exporting measurements or impulse responses as text
  • Changed: The choice of cycles or octave fractions for the frequency dependent window units is now in the Analysis preferences
  • Changed: Changes to the IR window settings in the IR windows dialog are applied as they are made
  • Changed: The default filenames for signals saved to file have more abbreviated signal names
  • Changed: Do not force exported impulse responses to be at least 1 second long
  • Changed: Do not set windows for imported IR beyond the range of the imported data
  • Changed: When exporting an impulse response as WAV without windowing or setting t=0 at a specified sample index the peak is no longer placed at 1 second but left wherever it appears in the raw data
  • Fixed: The measurement panel width was greater than needed to show the longest allowed measurement name
  • Fixed: Selecting another measurement when the spectrogram Y axis was frequency could reset the frequency span
  • Fixed: WAV files shorter than the FFT length dropped on the RTA caused an exception
  • Fixed: WAV files dropped on the RTA could show artefacts at around -162 dB
  • Fixed: Saving signal generator sequences with multiple repetitions as WAV in PCM24 format had discontinuities at the sequence boundaries
 

John Mulcahy

REW Author
Thread Starter
Joined
Apr 3, 2017
Messages
7,337
Builds updated to prevent unnecessary window applications when switching measurements.
 

tjcinnamon

Member
Joined
Dec 6, 2020
Messages
123
The builds have been updated today with the changes below. These should be the final additions to functionality, the focus will now move to fixing any issues found and then to release. Since so much has changed since 5.20.13 I'll end up releasing this as 5.21, likely with at least one 5.21 beta build ahead of the final release.

  • Added: The alignment tool has a choice of phase or impulse alignment modes. Impulse alignment mode uses cross-correlation of 1/3 octave zero phase filtered impulse responses, results should generally be very close to those using phase alignment but the impulse alignment ignores polarity, so it may find an alignment with a lower delay that requires a polarity inversion. That will be obvious from the filtered impulse graphs, since they will have opposite polarity.
  • Added: Impulse response window presets can now be generated and accessed through the IR windows dialog. Selecting a preset applies it to the currently selected measurement, something to bear in mind if the preset window is left open while switching between measurements.
  • Added: The IR windows dialog now has buttons to apply the window selections to the measurements selected in the All SPL or Impulse overlay graphs
  • Added: The EQ window impulse graph can show step responses
  • Added: Export impulse as wav has an option to place t=0 at a specified sample index, default is 256
  • Added: Analysis preferences has an option to place t=0 for imported IRs at sample 256, so exports/imports with t=0 at sample index 256 will preserve t=0 timing
  • Added: Trace arithmetic has an operation to divide the magnitudes of the traces
  • Added: Trace arithmetic operations to invert magnitude (zero phase) and phase are now included, both can be restricted to a specified frequency range. Those might be used to generate responses for use in convolvers.
  • Added: View preferences default trace colours panel has a button to set the original V5.20 default colours
  • Added: There is a Fit Y to data button on the extents dialog and a Ctrl+Alt+Y shortcut to fit Y axis to data on graphs with a frequency X axis
  • Added: There is an ALL SPL measurement action to make a copy of a response with an IR that is the smallest power of 2 that coves the windowed span
  • Added: Comments and headers can be omitted when exporting measurements or impulse responses as text
  • Changed: The choice of cycles or octave fractions for the frequency dependent window units is now in the Analysis preferences
  • Changed: Changes to the IR window settings in the IR windows dialog are applied as they are made
  • Changed: The default filenames for signals saved to file have more abbreviated signal names
  • Changed: Do not force exported impulse responses to be at least 1 second long
  • Changed: Do not set windows for imported IR beyond the range of the imported data
  • Changed: When exporting an impulse response as WAV without windowing or setting t=0 at a specified sample index the peak is no longer placed at 1 second but left wherever it appears in the raw data
  • Fixed: The measurement panel width was greater than needed to show the longest allowed measurement name
  • Fixed: Selecting another measurement when the spectrogram Y axis was frequency could reset the frequency span
  • Fixed: WAV files shorter than the FFT length dropped on the RTA caused an exception
  • Fixed: WAV files dropped on the RTA could show artefacts at around -162 dB
  • Fixed: Saving signal generator sequences with multiple repetitions as WAV in PCM24 format had discontinuities at the sequence boundaries
I was going to say, this is a heck of a major.minor.patch
 

serko70

Member
Joined
Oct 13, 2017
Messages
239
Location
Germany
More  
Preamp, Processor or Receiver
Marantz SR6015
Main Amp
Rotel Michi X3
Computer Audio
Intel NUC
DAC
Oppo 205
Universal / Blu-ray / CD Player
Oppo 205
Front Speakers
Focal Kanta 2
Center Channel Speaker
Linn
Surround Speakers
Focal Dome Flax
Surround Back Speakers
Focal Dome Flax
Front Height Speakers
Focal Dome Flax
Rear Height Speakers
Focal Dome Flax
Subwoofers
Focal Air
Video Display Device
LG 65 3D OLED
Streaming Subscriptions
TIDAL, ROON
The builds have been updated today with the changes below. These should be the final additions to functionality, the focus will now move to fixing any issues found and then to release. Since so much has changed since 5.20.13 I'll end up releasing this as 5.21, likely with at least one 5.21 beta build ahead of the final release.

  • Added: The alignment tool has a choice of phase or impulse alignment modes. Impulse alignment mode uses cross-correlation of 1/3 octave zero phase filtered impulse responses, results should generally be very close to those using phase alignment but the impulse alignment ignores polarity, so it may find an alignment with a lower delay that requires a polarity inversion. That will be obvious from the filtered impulse graphs, since they will have opposite polarity.
  • Added: Impulse response window presets can now be generated and accessed through the IR windows dialog. Selecting a preset applies it to the currently selected measurement, something to bear in mind if the preset window is left open while switching between measurements.
  • Added: The IR windows dialog now has buttons to apply the window selections to the measurements selected in the All SPL or Impulse overlay graphs
  • Added: The EQ window impulse graph can show step responses
  • Added: Export impulse as wav has an option to place t=0 at a specified sample index, default is 256
  • Added: Analysis preferences has an option to place t=0 for imported IRs at sample 256, so exports/imports with t=0 at sample index 256 will preserve t=0 timing
  • Added: Trace arithmetic has an operation to divide the magnitudes of the traces
  • Added: Trace arithmetic operations to invert magnitude (zero phase) and phase are now included, both can be restricted to a specified frequency range. Those might be used to generate responses for use in convolvers.
  • Added: View preferences default trace colours panel has a button to set the original V5.20 default colours
  • Added: There is a Fit Y to data button on the extents dialog and a Ctrl+Alt+Y shortcut to fit Y axis to data on graphs with a frequency X axis
  • Added: There is an ALL SPL measurement action to make a copy of a response with an IR that is the smallest power of 2 that coves the windowed span
  • Added: Comments and headers can be omitted when exporting measurements or impulse responses as text
  • Changed: The choice of cycles or octave fractions for the frequency dependent window units is now in the Analysis preferences
  • Changed: Changes to the IR window settings in the IR windows dialog are applied as they are made
  • Changed: The default filenames for signals saved to file have more abbreviated signal names
  • Changed: Do not force exported impulse responses to be at least 1 second long
  • Changed: Do not set windows for imported IR beyond the range of the imported data
  • Changed: When exporting an impulse response as WAV without windowing or setting t=0 at a specified sample index the peak is no longer placed at 1 second but left wherever it appears in the raw data
  • Fixed: The measurement panel width was greater than needed to show the longest allowed measurement name
  • Fixed: Selecting another measurement when the spectrogram Y axis was frequency could reset the frequency span
  • Fixed: WAV files shorter than the FFT length dropped on the RTA caused an exception
  • Fixed: WAV files dropped on the RTA could show artefacts at around -162 dB
  • Fixed: Saving signal generator sequences with multiple repetitions as WAV in PCM24 format had discontinuities at the sequence boundaries
REW is fast becoming the most powerful DRC tool in the market and it's still FREE! We cannot thank you enough John!

I've done some draft work using some of the new additions. I am sharing here so everyone can play with and test for any bugs:

-Mixed phase (Linear up to 192Hz, min phase therafter) FIR filters created by response inversion over a target curve
-Convolved with crossover linearization impulse (rePhase export) for 3-way speaker with 4th & 2nd order XOs
-Excess phase inversion between 200-1000Hz (echo free)
-Some auto trimming applied to filters to decrease number of taps
 

Attachments

  • Demo1.zip
    16.7 MB · Views: 14

serko70

Member
Joined
Oct 13, 2017
Messages
239
Location
Germany
More  
Preamp, Processor or Receiver
Marantz SR6015
Main Amp
Rotel Michi X3
Computer Audio
Intel NUC
DAC
Oppo 205
Universal / Blu-ray / CD Player
Oppo 205
Front Speakers
Focal Kanta 2
Center Channel Speaker
Linn
Surround Speakers
Focal Dome Flax
Surround Back Speakers
Focal Dome Flax
Front Height Speakers
Focal Dome Flax
Rear Height Speakers
Focal Dome Flax
Subwoofers
Focal Air
Video Display Device
LG 65 3D OLED
Streaming Subscriptions
TIDAL, ROON
The measurements were 1M in length so I had to trim & split to be able to attach here:
 

Attachments

  • Demo2.zip
    18.8 MB · Views: 16
Status
Not open for further replies.
Top Bottom