Thanks so much,test it today with a powered speaker,nothing wrong with it,it's OK now.Try taking a measurement using periodic noise and without averaging. The microphone should be in a fixed location, e.g. on a tripod.


-
AUDIO VIDEO PROCESSING, SETUP & ENVIRONMENTOfficial REW (Room EQ Wizard) Support Forum Audiolense User Forum Calibration Equipment Auto-EQ Platforms / Immersive Audio Codecs Video Display Technologies / Calibration AV System Setup and Support Listening Room / Home Theater Build Projects Room Acoustics and Treatments AV Showcase Movies / Music / TV / Streaming
-
AUDIO VIDEO DISCUSSION / EQUIPMENTHome Theater / Audio and Video - Misc Topics Essence For Hi Res Audio AV Equipment Advice and Pricing Awesome Deals and Budget AV Equipment AV Receivers / Processors / Amps UHD / Blu-ray / CD Players / Streaming Devices Two Channel Hi-Fi Equipment DIY Audio Projects Computer Systems - HTPC / Gaming HD and UHD Flat Screen Displays Projectors and Projection Screens AV Accessories Buy - Sell - Trade
Navigation
Install the app
How to install the app on iOS
Follow along with the video below to see how to install our site as a web app on your home screen.
Note: This feature may not be available in some browsers.
More options
You are using an out of date browser. It may not display this or other websites correctly.
You should upgrade or use an alternative browser.
You should upgrade or use an alternative browser.
REW Beta Release REW API beta releases
- Thread starter John Mulcahy
- Start date

John Mulcahy
REW Author
Thread Starter
- Joined
- Apr 3, 2017
- Posts
- 9,429
Trace arithmetic on measurements with impulse responses is done on the impulse responses using unsmoothed data, the smoothing of the A measurement is applied to the result. To do arithmetic on smoothed data make magnitude copies and do the arithmetic on those, or for magn and phase export the measurements as text and reimport for arithmetic.John, I"m trying to get a microphone correction file. I made a measurement with a reference microphone(A), a second measurement with an unknown microphone(B). If I"m doing zero smoothing, arithmetic |B|/|A| gives a repetition of the unsmoothed measure B minus the full scale of the input level. If I smooth out both measurements to 1/1 it turns out almost fine (coincidence), but the discrepancy is about 2 dB after 4 kHz. If I smooth out 1/48, it turns out better, but after 8kHz, the discrepancy is 2dB. How do I do what I want to do correctly?
I will try. Thank you.To do arithmetic on smoothed data make magnitude copies and do the arithmetic on those, or for magn and phase export the measurements as text and reimport for arithmetic.
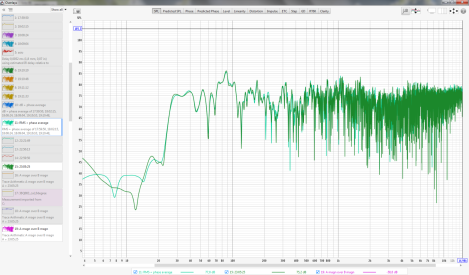
There is a wish. For example, the All Spl window. If in the list of measurements twice click on the latter, it is highlighted. And if on any other, it is not highlighted. It is impossible to change the measurement order. Is it possible to make it so that with double clicking on any measurement it is highlighted. For example, I need this for a screenshot to pay attention to the desired measurement.
John Mulcahy
REW Author
Thread Starter
- Joined
- Apr 3, 2017
- Posts
- 9,429
Double clicking on a measurement in the list of any overlay window, including All SPL, makes that measurement the current selection for the individual measurement graphs, as indicated by the blue bar on the right hand side of the measurement. If you have selected the option to "Highlight current selection on overlays" in the View preferences trace highlight options the current selection is highlighted.For example, the All Spl window. If in the list of measurements twice click on the latter, it is highlighted.
Measurement order can be changed by drag and drop. To move an individual measurement in the Overlays list press and hold the left mouse button.It is impossible to change the measurement order.
You can highlight any measurement or trace by moving the mouse over its entry in the graph legend. Opening the image capture dialog using Alt+C allows that to be captured.Is it possible to make it so that with double clicking on any measurement it is highlighted. For example, I need this for a screenshot to pay attention to the desired measurement.
It doesn"t work for me.Double clicking on a measurement in the list of any overlay window, including All SPL, makes that measurement the current selection for the individual measurement graphs, as indicated by the blue bar on the right hand side of the measurement. If you have selected the option to "Highlight current selection on overlays" in the View preferences trace highlight options the current selection is highlighted.
Here I meant that the measurements were grouped for my goals, and therefore I cannot drag them.Measurement order can be changed by drag and drop.
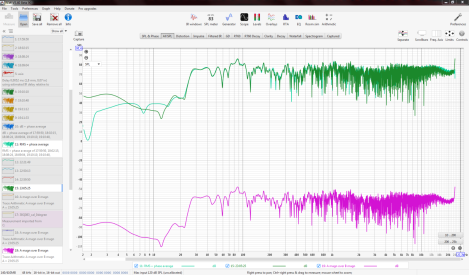
Yes, when the mouse pointer is over an entry in the legend, the measurement is highlighted. But I want the highlighting to always work after I"ve made the measurement the current double-click. Even if REW has screenshot hot buttons, it is more convenient to use the mouse. I also almost always use OS scissors.You can highlight any measurement or trace by moving the mouse over its entry in the graph legend. Opening the image capture dialog using Alt+C allows that to be captured.
Attachments
John Mulcahy
REW Author
Thread Starter
- Joined
- Apr 3, 2017
- Posts
- 9,429
I'll look at it. In the meantime you can use Ctrl+H to toggle the highlight for the selected measurement.
It works. Each time you press Ctrl+H, it highlights the selected measurement and turns it off. It would be possible to make the first double click turn on the backlight, the second double click turn it off.you can use Ctrl+H to toggle the highlight for the selected measurement.

John Mulcahy
REW Author
Thread Starter
- Joined
- Apr 3, 2017
- Posts
- 9,429
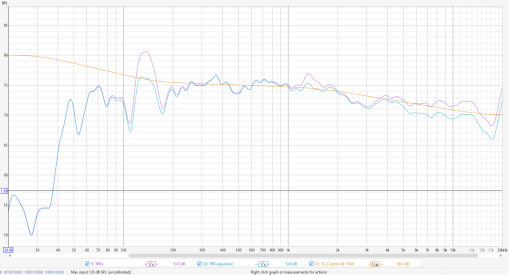
Shelf looks to be about -2 dB, wouldn't describe that as aggressive. If you want the result to follow the target more closely give it more latitude in the boost limits.
With everything maxed out, it still settles on a negative shelf that drops it below target. The main issue is that the other atmos channels have similar responses but they don't get a shelf like this, so it's introducing somewhat of an imbalance between TRL and TRR speaker pair.Shelf looks to be about -2 dB, wouldn't describe that as aggressive. If you want the result to follow the target more closely give it more latitude in the boost limits.

For reference, here's TRL with everything maxed out. I generally keep boost at 0 or very low because it seems to be inconsistent.

Here's how their pre-EQ spatially averaged responses look. You can see that they don't have a lot of variation in the highs between each other to begin with.

John Mulcahy
REW Author
Thread Starter
- Joined
- Apr 3, 2017
- Posts
- 9,429
I can take a look tomorrow if you attach the mdat and the house curve file.
Thanks for the prompt response! Here you go.
Just as a FYI, the responses are aligned to the target @ 75db, however, after FDW with 15 cycles, the level drops by about 0.5db, that's why in my screenshots you saw the level @ 74.5db.
Just as a FYI, the responses are aligned to the target @ 75db, however, after FDW with 15 cycles, the level drops by about 0.5db, that's why in my screenshots you saw the level @ 74.5db.
Attachments
John Mulcahy
REW Author
Thread Starter
- Joined
- Apr 3, 2017
- Posts
- 9,429
Builds updated today (beta 91) with these changes:
- Changed: Target match shelf filter cuts adjusted to reduce risk of leaving response below target
- Changed: Frequency meter shows a filtered average frequency
- Changed: Removed View preference to highlight the selected measurement on overlays, can use Ctrl+H to toggle highlight
- Fixed: The waterfall and spectrogram 3D plots did not reflect the banded colours choice of the graph colour scheme
- Fixed: Measurements started via the API would not wait for a timing reference unless Measurement sweep had been selected as the signal on the generator
- Fixed: Changes to the cubehelix 3D colour scheme settings were not updating the plot
John Mulcahy
REW Author
Thread Starter
- Joined
- Apr 3, 2017
- Posts
- 9,429
I have made a small change to the shelf handling in the latest beta.Here you go.
Can confirm it's behaving more predictably with the high shelf. Thank you for this update!I have made a small change to the shelf handling in the latest beta.
Prolab
Registered
- Joined
- May 5, 2024
- Posts
- 2
More
- Main Amp
- Marantz
- Additional Amp
- Sound Magus
- Universal / Blu-ray / CD Player
- Unşversal
- Front Speakers
- Yamaha
- Center Channel Speaker
- Eltax
- Surround Speakers
- Eltax
- Subwoofers
- Definitive
- Video Display Device
- 55” Sony 4K
I can not find alignment tool section, Isn't there ?
Prolab
Registered
- Joined
- May 5, 2024
- Posts
- 2
More
- Main Amp
- Marantz
- Additional Amp
- Sound Magus
- Universal / Blu-ray / CD Player
- Unşversal
- Front Speakers
- Yamaha
- Center Channel Speaker
- Eltax
- Surround Speakers
- Eltax
- Subwoofers
- Definitive
- Video Display Device
- 55” Sony 4K
I just found itI can not find alignment tool section, Isn't there ?
")
@John Mulcahy, some JREs ( on macos 15.5 x86 and ARM64 ) from latest beta in the 3d visualization overlay using the data set from the ASCILab F6Bs ASR review.
The 3D plotting is a really nice addition to data visualization with REW, by the way. Could we see balloon plots in a future release?
The 3D plotting is a really nice addition to data visualization with REW, by the way. Could we see balloon plots in a future release?
Attachments
John Mulcahy
REW Author
Thread Starter
- Joined
- Apr 3, 2017
- Posts
- 9,429
Builds updated today (beta 92) with these changes:
- Added: Overlays 3D plot has an option to highlight the data sets that make up the plot
- Fixed: Index out of bounds errors when viewing 3D plots
John Mulcahy
REW Author
Thread Starter
- Joined
- Apr 3, 2017
- Posts
- 9,429
No plans for balloon plots. The idea that horizontal and vertical slices can be meaningfully interpolated to produce the response over a sphere seems more than a little optimistic to me, the plot is unlikely to resemble reality off the measured planes.Could we see balloon plots in a future release?
The links in the first post are still pointing at 91 for me.Builds updated today (beta 92)
John Mulcahy
REW Author
Thread Starter
- Joined
- Apr 3, 2017
- Posts
- 9,429
Yes, having a problem with the upload, bear with me...
Hi John,
When performing graph equalization by dragging filters in EQ tab, the pop up buttons (on the bottom right of the graphing area) used to change the frequency axis, often block the filter editing pointers when working with large, negative filter Qs at higher frequencies.
One has to change the amplitude axis upwards to access the pointer again.
It would be great to be able to toggle those buttons on and off. Thanks.
John Mulcahy
REW Author
Thread Starter
- Joined
- Apr 3, 2017
- Posts
- 9,429
Beta 92 files should be available now.
John Mulcahy
REW Author
Thread Starter
- Joined
- Apr 3, 2017
- Posts
- 9,429
Fixed for the next build.When performing graph equalization by dragging filters in EQ tab, the pop up buttons (on the bottom right of the graphing area) used to change the frequency axis, often block the filter editing pointers when working with large, negative filter Qs at higher frequencies.


Popular tags
20th century fox
4k blu-ray
4k uhd
4k ultrahd
action
adventure
animated
animation
bass
blu-ray
calibration
comedy
comics
denon
dirac
dirac live
disney
dolby atmos
drama
fantasy
hdmi 2.1
home theater
horror
kaleidescape
klipsch
lionsgate
marantz
movies
onkyo
paramount
pioneer
rew
romance
sci-fi
scream factory
shout factory
sony
stormaudio
subwoofer
svs
terror
thriller
uhd
ultrahd
ultrahd 4k
universal
value electronics
warner
warner brothers
well go usa