REW Beta Release REW API beta releases

As mainly measurement signal is not from REW output, only reasonable way is to use RTA and peak hold measurements.
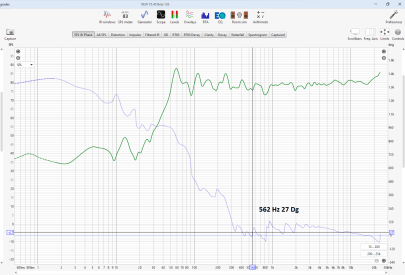
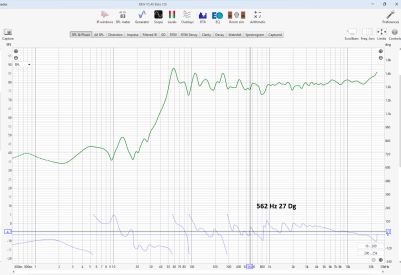
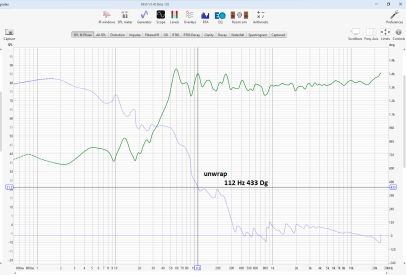
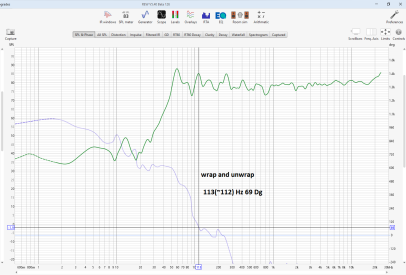
If the measurement signal has a defined duration (e.g. a sweep) you can obtain the result from the normal input, though it is more awkward. Here's an example of capturing a 10 second log sweep using a 1M FFT (so the FFT spans 21.8 seconds at the 48k sample rate used). I started the RTA, waited for the first capture to complete, played the sweep then stopped the RTA once the second capture had been made. Rectangular window is used as the whole input signal fits within a single FFT span and to prevent attenuating parts of the capture. I had averaging on in the settings but it isn't needed or used in this case. This process could be automated using the API.

I will look at options for capturing and displaying individual input peak traces.

1778966247782.png
 
Builds updated today (beta 126) with these changes:
  • Added: Phase graph controls have options to set frequency limits for the phase traces
  • Added: RTA multi-input capture shows individual peak traces for the first two inputs, they will be saved as measurements when the buttons to save peak or save both are used if the option to save inputs individually is selected
  • Changed: Retain background colours for measurements when they are selected, selection status is indicated by the thumbnail and the measurement name which are greyed out for measurements that are not selected
  • Changed: Rearranged the STI panel
  • Fixed: Overlay graph measurement thumbnails for grouped measurements could be missing
 
John, I have 10 subwoofer measurements. I'm looking at the 'spectrogram' tab. By default, my time range for drawing a spectrogram is -2 ms +30 ms. The full frequency range measurement for a non-subwoofer is displayed as in the settings. For a subwoofer measured at full range, the bottom data starts not at -2 ms, but at +4 ms for one measurement, at +16 ms for the second measurement, at +13 ms for the third measurement, and ends at the top not at +30 ms, but differently in each measurement. Why?
 
I looked at all the measurements. The time range is always the same as in the settings. Only with a start offset. I need the time axis to always remain fixed. To understand when comparing what changes from measurement to measurement. Is this possible? What settings should I use for this?
 
Thank you. This solved one problem, but did not solve the comparison problem. Because the peaks are at different times. And also because for subwoofer measurements, REW considers the first maximum peak to be the peak of the impulse. Although there are 2 more in front of it, the first of which, in my opinion, is the real first response of the driver to the test impulse. Perhaps if there was an option for measuring subwoofers 'consider the first peak that is greater than 20% to be a peak', this would solve my problem. And not only for me. Does this option make sense?
 
No. The spectrogram covers a time span, choosing a different reference for the pre and post parts of that span wouldn't change the result.
 
Hi @John Mulcahy ,
I'd like to report a small bug I've reproduced in the current beta.
When the LFE channel is renamed to a custom name, the -10 dB option during measurement stops working. It seems the feature relies on the hardcoded "LFE" channel name rather than the user-defined one.
Would it be possible to have this resolved in a future beta release?
 
I don't see how. How would REW distinguish between renaming the LFE channel because it's not the LFE and renaming it because you want to call it something else?
 
Hi John,
That's a fair point. REW can't know the intent behind a rename.
Two possible approaches come to mind:
  1. Keep a fixed "LFE" entry in the dropdown that cannot be renamed — only remapped to a hardware channel. This preserves the semantic meaning regardless of the label.
  2. Add a dedicated checkbox or flag (e.g. "This channel carries LFE signal") so the -10 dB behaviour is explicitly tied to that flag rather than the channel name.
The reason I bring this up is that it took me a significant amount of time to diagnose why the -10 dB option wasn't being applied during measurement — the root cause being the rename. A warning or note in the UI near that option would help future users avoid the same confusion.
Thanks for considering it!
 

Attachments

  • 1779728035315.png
    1779728035315.png
    21.1 KB · Views: 16
Hi @John Mulcahy,

Is there a way to check/test that the UMIK-1 is working nicely with the USB port on the laptop? I purchased a new Dell laptop and used my UMIK-1 to take some measurements. I was trying to find the proper center position to place the mic using CENTER channel as acoustic reference.

To get the best position for mic, I ran the full sweep (0-24Khz) using 1M for LEFT and RIGHT channels and then opened up the INFO popup of each channel to check the SYSTEM DELAY values.

This delay value would not change much as I moved the mic around either little bit or by a lot (about 1 feet on either side even moving forward and backwards a little). When it did change, it jumped around in big numbers instead of in smaller numbers (as I was expecting). My values range from -0.07ms to 0.19ms between LEFT and RIGHT channel. I am not able to get them closer to each other. Any pointers on what I should try to get them closer? Anyway to know my UMIK-1 is working properly with the USB port on the laptop i.e. there are no clock issues happening with it? I can confirm that I did set the UMIK-1 to record at 24-bits/48Khz in Windows Sound settings.
 
Hi John,
Just a thought for future development of the RTA window. It would be great to be able to see a live spectrogram here to display the history of the signal being measured. For an example, here's a screenshot from some antique software that I used to love, I just can't get it to run on my modern system anymore. For REW I think it would be great to have an option to split the RTA window to show the live spectrum display as well as a spectrogram
1780159654390.png
 
Check for consistent clock adjustment figures for each measurement.
Hi John,

In the INFO panel CLOCK ADJUSTMENT jumps from -20.9 for LEFT channel to -33.8 ppm for the RIGHT channel using CENTER channel as the acoustic reference. Center channel itself has -34.2 ppm of clock adjustment shown.

I'm sorry, I do not understand what does this mean and why it jumped so much. Is there anything I can do to make the clock adjustments same for all measurements like add some offset or select multiple adjustments to get their clock adjustments same? Can you provide some guidance? If center channel is the reference shouldn't its clock adjustment value be 0 being the reference?

These measurements were taken using the V5.40 Beta 124 using the sequential measurement option to measure all 8 channels (7.1) with 3 second delay between each measurement and using CENTER channel as the acoustic reference.
 
Clock adjustment is a check for difference in clock rate between the playback and recording devices. It will only be truly and reliably zero if the playback and recording device is the same, not possible with a USB mic. Typical values <100ppm are normal. If you want to check accuracy and repeatability of measurements with acoustic timing reference, just check the impulse response overlay and zoom zoom zoom in on the impulses between multiple repeated measurements. You may also compare the phase response of measurements in the same way, however I think people are more likely to understand the impulse change as a function of distance.
 
Is there anything I can do to make the clock adjustments same for all measurement
There's no need for them to be identical, clocks vary slightly with temperature so a slow change of adjustment between measurements is not unusual. You could try changing the reference, e.g. use the left or the right speaker, but those figures don't indicate any problems. Difficult to say much more without seeing an mdat with measurements of each speaker. There's no need to exactly centre the mic for measurements, but if you want to do that use a tape measure, no ambiguity there. :)
 
John, hi. I noticed strange behavior of the phase trace. If the phase line does not cross +180 -180 degrees, it is always displayed correctly. If the phase line crosses +180 -180 degrees, unwrap the phase and place a marker with the mouse pointer on the part that is above 180 degrees, then wrap the phase and immediately unwrap, then the phase graph jumps from 450 degrees, where the marker was before wrap, to -360 degrees, and becomes 90 degrees on the marker. That is, the same point on the phase graph not only shifts, but changes its value.
 
I noticed strange behavior of the phase trace.
Some images might make that clearer, but it sounds like it is behaving as expected. 450 degrees and 90 degrees are the same phase and unwrapping ensures the value at the cursor lies within -180 .. 180.
 
Images 1 and 2 are ok. In the 3rd picture, the 112 Hz phase graph point has a phase of 433 degrees. After wrap and unwrap, the 112 Hz phase plot point has a phase of 69 degrees. The same graph point should not have different values within the same graph. I understand that 69 + 360 is approximately 433. But if the unwrapped phase graph is shifted for better display at the selected frequency, then the axis of the phase graph must be shifted so that the same frequency has the same value in all displays.
 

Attachments

  • 1.PNG
    1.PNG
    150.4 KB · Views: 20
  • 2.PNG
    2.PNG
    149.2 KB · Views: 17
  • 3.PNG
    3.PNG
    147.8 KB · Views: 13
  • 4.PNG
    4.PNG
    139 KB · Views: 17
Phase unwrapping is relative, it has to start somewhere. The reference is the wrapped phase value at the cursor frequency. That's how it has always worked in REW. The graphs are correct.
 
it has to start somewhere
Everything is so, but. When the phase graph is formed, for the purpose of discussing the behavior of the phase, we can assume that all the values of the expanded phase on this graph are absolute. Otherwise, I will say that I see 433 degrees at a frequency of 112 hertz, and my opponent will say that this is not so, he sees 69 degrees. I will say that he needs to find the cause of the phase shift, and he will say that there is no such thing, there is no need to look for anything.
Perhaps if you add a checkbox 'link the axis of the unfolded phase to the graph', there will be no such misunderstandings.
 
Where has the "average responses" button on the All SPL tab on mac osx most recent beta gone?
TIA!
 
Last edited by a moderator:
Back
Top