





REW Beta Release REW API beta releases

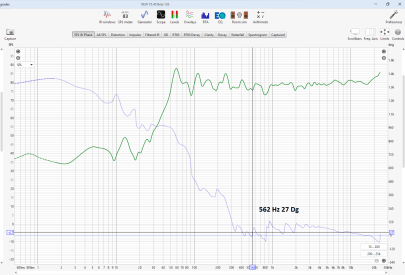
As mainly measurement signal is not from REW output, only reasonable way is to use RTA and peak hold measurements.
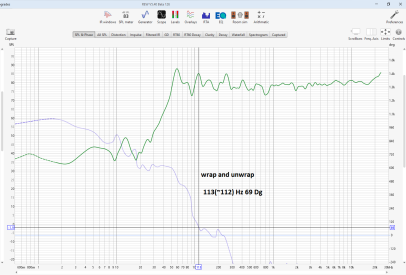
If the measurement signal has a defined duration (e.g. a sweep) you can obtain the result from the normal input, though it is more awkward. Here's an example of capturing a 10 second log sweep using a 1M FFT (so the FFT spans 21.8 seconds at the 48k sample rate used). I started the RTA, waited for the first capture to complete, played the sweep then stopped the RTA once the second capture had been made. Rectangular window is used as the whole input signal fits within a single FFT span and to prevent attenuating parts of the capture. I had averaging on in the settings but it isn't needed or used in this case. This process could be automated using the API.

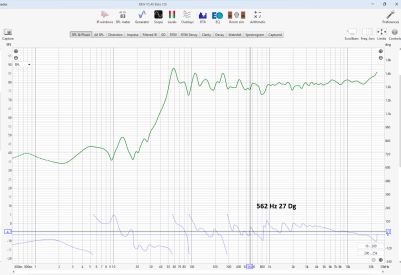
I will look at options for capturing and displaying individual input peak traces.

1778966247782.png
 
Builds updated today (beta 126) with these changes:
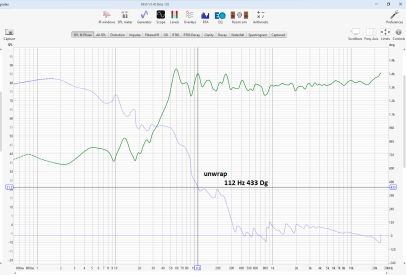
  • Added: Phase graph controls have options to set frequency limits for the phase traces
  • Added: RTA multi-input capture shows individual peak traces for the first two inputs, they will be saved as measurements when the buttons to save peak or save both are used if the option to save inputs individually is selected
  • Changed: Retain background colours for measurements when they are selected, selection status is indicated by the thumbnail and the measurement name which are greyed out for measurements that are not selected
  • Changed: Rearranged the STI panel
  • Fixed: Overlay graph measurement thumbnails for grouped measurements could be missing
 
John, I have 10 subwoofer measurements. I'm looking at the 'spectrogram' tab. By default, my time range for drawing a spectrogram is -2 ms +30 ms. The full frequency range measurement for a non-subwoofer is displayed as in the settings. For a subwoofer measured at full range, the bottom data starts not at -2 ms, but at +4 ms for one measurement, at +16 ms for the second measurement, at +13 ms for the third measurement, and ends at the top not at +30 ms, but differently in each measurement. Why?
 
I looked at all the measurements. The time range is always the same as in the settings. Only with a start offset. I need the time axis to always remain fixed. To understand when comparing what changes from measurement to measurement. Is this possible? What settings should I use for this?
 
Thank you. This solved one problem, but did not solve the comparison problem. Because the peaks are at different times. And also because for subwoofer measurements, REW considers the first maximum peak to be the peak of the impulse. Although there are 2 more in front of it, the first of which, in my opinion, is the real first response of the driver to the test impulse. Perhaps if there was an option for measuring subwoofers 'consider the first peak that is greater than 20% to be a peak', this would solve my problem. And not only for me. Does this option make sense?
 
No. The spectrogram covers a time span, choosing a different reference for the pre and post parts of that span wouldn't change the result.
 
Back
Top