V5.20.14 early access build

Status
Not open for further replies.

Lowclock

New Member
Joined
Mar 22, 2023
Messages
58
Fair enough! I usually use an acoustic timing reference so I've never left it on to notice it before. I wonder if it would be a good idea to have a checkbox in the generator window for it or something since it kind of invalidates the channel selection box in there.
 

John Mulcahy

REW Author
Thread Starter
Joined
Apr 3, 2017
Messages
7,326
Makes sense.

playpanel.jpg
 

boxerfan88

Registered
Joined
Aug 18, 2019
Messages
24
More  
Preamp, Processor or Receiver
Yamaha RX-A3030
Main Amp
DA&T A38 Integrated
Front Speakers
Usher Mini Dancer 2
Center Channel Speaker
Usher
Surround Speakers
Bose
Subwoofers
Orisun DD12
Video Display Device
Samsung Plasma TV
Hi John,

I found some trouble with the latest build 5_20_14ea47.

When I import sweep recordings, the distortion graph is all greyed out.

2023-03-31-22-44-08-Q-Dir-11-19.png


It does not happen with 5_20_14ea39.
 
Last edited:

G29

Member
Joined
Jun 20, 2019
Messages
79
Hey John,

I would like to throw in a feature request to your existing pile.

Would like to be able to display a 3 and 4-way XO/individual driver measurements in the Waterfall plot in a similar way as the existing 2-way functionality operates. It may put a burden on processor requirements for resizing/positioning though. Much appreciated if possible.

Thanks much.
 

G29

Member
Joined
Jun 20, 2019
Messages
79
I don't understand what you are after there, can you elaborate?
Sure, simultaneously being able to display 4 items (4 XO filters, 4/SubLowMidHigh driver measurements, etc.) in a Waterfall plot versus just 1 or 2. Same functionality, just increase the number of plots from 2 to 4.
 

John Mulcahy

REW Author
Thread Starter
Joined
Apr 3, 2017
Messages
7,326
Can't recall seeing more than one driver on a waterfall plot. Presumably it would be helpful for design in some way? What is the benefit?
 

G29

Member
Joined
Jun 20, 2019
Messages
79
Can't recall seeing more than one driver on a waterfall plot. Presumably it would be helpful for design in some way? What is the benefit?
I use it to visualize a 2-way, 3-way, 4-way XO speaker and them compare it against their actual measurements.

I make FIR XO's in RePhase and then analyze them in REW before applying them to the actual system. I can inspect all 4 in 2D plots, but not 3D Waterfall plots unless I pre-composite them with aritmetic functions first and lose all of the XO overlap details.
 

sm52

Member
Joined
Mar 14, 2019
Messages
892

G29

have you seen this somewhere? Several waterfall graphs in one picture? I think it will be porridge.
 

G29

Member
Joined
Jun 20, 2019
Messages
79

G29

have you seen this somewhere? Several waterfall graphs in one picture? I think it will be porridge.
I do it all the time with 2 adjacent drivers or XO FIRs, thus the request to do it with a 3 or 4 way speaker design for a complete view of the entire speaker.

With shallow slopes, you can analyze the overlap of more than 2 drivers.

To address yours specific question if I have seen it somewhere.

Comparing 3D solids modeling to sound may not be an apples-2-apples comparison, but ... If you are designing a V-4, V-6 or V-8 in CAD software, it usually doesn't restrict you to 3D viewing of just 1 or 2 cylinders at a time, but allows you to view the entire engine if desired in 3D. Drivers are motors right ? =)


LowMid.png
 
Last edited:

boxerfan88

Registered
Joined
Aug 18, 2019
Messages
24
More  
Preamp, Processor or Receiver
Yamaha RX-A3030
Main Amp
DA&T A38 Integrated
Front Speakers
Usher Mini Dancer 2
Center Channel Speaker
Usher
Surround Speakers
Bose
Subwoofers
Orisun DD12
Video Display Device
Samsung Plasma TV

sm52

Member
Joined
Mar 14, 2019
Messages
892

G29

This is interesting. I didn't know about this possibility. Thank you for the clarification.
 

G29

Member
Joined
Jun 20, 2019
Messages
79
@sm52

Sorry I wasn't more clear. It took me a while to understand your usage of the term "porridge" because I was thinking horizontal distribution and not overlays for this use case. I was not suggesting 4 overlays occupying the same X/Y/Z space because as you put it, it would be "porridge". =)
 
Last edited:

sm52

Member
Joined
Mar 14, 2019
Messages
892
I was not suggesting 4 overlays occupying the same X/Y/Z space
Now I don't understand what you meant. Now you can watch the waterfall of the main measurement and overlay. Your wish is to watch + a few other overlays? No?
 

G29

Member
Joined
Jun 20, 2019
Messages
79
Now I don't understand what you meant. Now you can watch the waterfall of the main measurement and overlay. Your wish is to watch + a few other overlays? No?
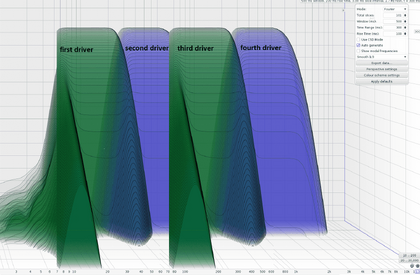
I meant displaying 4 items at different X offsets (x1=sub freq range, x2=bass freq range, x3=mid freq range, x4=high freq range) so basically expanding the following to 3 or 4 horizontally
.
LowMid.png


versus 4 of these occupying the same x1, y1, z1 location (porridge).

Sub144Ring_a.png


Hope that is more clear.
 

serko70

Member
Joined
Oct 13, 2017
Messages
239
Location
Germany
More  
Preamp, Processor or Receiver
Marantz SR6015
Main Amp
Rotel Michi X3
Computer Audio
Intel NUC
DAC
Oppo 205
Universal / Blu-ray / CD Player
Oppo 205
Front Speakers
Focal Kanta 2
Center Channel Speaker
Linn
Surround Speakers
Focal Dome Flax
Surround Back Speakers
Focal Dome Flax
Front Height Speakers
Focal Dome Flax
Rear Height Speakers
Focal Dome Flax
Subwoofers
Focal Air
Video Display Device
LG 65 3D OLED
Streaming Subscriptions
TIDAL, ROON
minor bug report: predicted GD graph in EQ window loses smoothing when a new filter is manually added!

GD.jpg
GD2.jpg
 

G29

Member
Joined
Jun 20, 2019
Messages
79
Y-Axis display issue.

Sometimes the bottom (low frequency range) of the Spectrogram displays blank space instead of the plot.

This plot shows the bottom is blank below @ 48Hz.

UPDATE: The bottom of the plot is tied to the After Peak Span settings so this may be as designed.


Y Axis Display Issue.png
 
Last edited:

John Mulcahy

REW Author
Thread Starter
Joined
Apr 3, 2017
Messages
7,326
The minimum frequency for the plot is determined by the after peak span.
 

John Mulcahy

REW Author
Thread Starter
Joined
Apr 3, 2017
Messages
7,326
Builds updated today with these changes:
  • Added: The RTA distortion settings have a control for the highest harmonic to include in the calculated THD figure
  • Added: Averaging measurements averages their distortion data if they cover the same frequency range at the same resolution
  • Added: There is now a help menu entry to generate a diagnostic file that zips REW's log files and a soundcard debug file
  • Changed: When the distortion graph Y axis is dBr show the equivalent major percentage figures on the right hand side
  • Changed: Added a checkbox in the generator playback panel to choose whether the signal should also be sent to the timing reference output (previously it went to the timing reference output whenever a timing reference measurement mode was selected). This setting does not affect sweep measurements, only the generator behaviour when not measuring.
  • Changed: RTA THD figure shows which harmonics are included
  • Fixed: X axis zoom buttons could stop working at very high time axis zooms
  • Fixed: RTA distortion panel text did not update when distortion settings changed if the RTA was not running
  • Fixed: Distortion graph THD subscript for harmonics showed the chosen calculation limit even if there were fewer harmonics available
  • Fixed: Predicted group delay smoothing did not match measurement when filters changed
 
Status
Not open for further replies.
Top Bottom