John Mulcahy
REW Author
Thread Starter
- Joined
- Apr 3, 2017
- Posts
- 9,441
The panel in the RTA window shows values from the current RTA input data analysis, there is no equivalent data for saved measurements and if there were I don't know how I would go about deciding whether the panel should show the actual data or something pulled from a saved measurement.Would it be possible to store distortion analysis from FFT in the .mdat file the way which would allow to show it again in the FFT window after loading an existing .mdat file? Currently it's saved as a comment and not reflected in the "Show distortion" overlay.
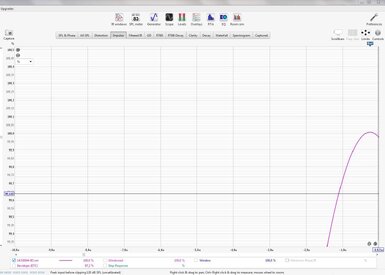
I could create a sort of minimal distortion data set when saving RTA data that has THD info. That way the data could be viewed on the distortion graphs, although it would just appear for a narrow span around the fundamental frequency (1/3 octave, for example). Example of how that would look below: