






-
AUDIO VIDEO PROCESSING, SETUP & ENVIRONMENTOfficial REW (Room EQ Wizard) Support Forum Audiolense User Forum Calibration Equipment Auto-EQ Platforms / Immersive Audio Codecs Video Display Technologies / Calibration AV System Setup and Support Listening Room / Home Theater Build Projects Room Acoustics and Treatments AV Showcase Movies / Music / TV / Streaming
-
AUDIO VIDEO DISCUSSION / EQUIPMENTHome Theater / Audio and Video - Misc Topics Essence For Hi Res Audio AV Equipment Advice and Pricing Awesome Deals and Budget AV Equipment AV Receivers / Processors / Amps UHD / Blu-ray / CD Players / Streaming Devices Two Channel Hi-Fi Equipment DIY Audio Projects Computer Systems - HTPC / Gaming HD and UHD Flat Screen Displays Projectors and Projection Screens AV Accessories Buy - Sell - Trade
Navigation
Install the app
How to install the app on iOS
Follow along with the video below to see how to install our site as a web app on your home screen.
Note: This feature may not be available in some browsers.
More options
You are using an out of date browser. It may not display this or other websites correctly.
You should upgrade or use an alternative browser.
You should upgrade or use an alternative browser.
FSAF (Fast subband adaptive filtering) measurement
- Thread starter John Mulcahy
- Start date


John Mulcahy
REW Author
Thread Starter
- Joined
- Apr 3, 2017
- Posts
- 9,589
No.
I'm a fan of M-Noise for general noise stimulus that resembles audio spectrum, a lot better than pink noise anyway. I think Stoneeh's trying to compare result of FSAF to a multitone IMD type of measurement, so needs to keep the magnitude spectrum and crest factor similar or it's not a very equal comparison.
The only reason for the existence of simplified tests like sine sweep and multi-tone IMD tests is their low computational load. Their interpretation in terms of music is ... debatable. Many self-proclaimed experts claim that by looking at FR, harmonics, and spinograms, they can predict how a loudspeaker will sound in a given room. Others call it snake oil.
FSAF comes from the opposite direction. It allows you to separate distortions from the original, on the music you listen to. Then you are free to come up with simplified tests that are consistent with your perception of the distortions that are meaningful to you (because each person is unique hearing-wise). Not vice versa.
FSAF comes from the opposite direction. It allows you to separate distortions from the original, on the music you listen to. Then you are free to come up with simplified tests that are consistent with your perception of the distortions that are meaningful to you (because each person is unique hearing-wise). Not vice versa.
It allows you to separate distortions from the original, on the music you listen to
what does "original" refer to here please?
What level of explanation do you need? PhD or 5 years old?
The "original" does not refer to master tapes or acoustic fields in the recording studio. It refers to the digital recordings available to the end-user. It is not a problem to equalize your acoustic system to a picture-perfect, ruler-flat FR (say, 1m on the axis, integrated over a sphere by an omnidirectional mic). This signal is supposed to be a linear-time-invariant (LTI) transformation of the digital recordings - but it is not. The differences from the LTI are what FSAF sees as distortions. Does this explanation suffice?
The "original" does not refer to master tapes or acoustic fields in the recording studio. It refers to the digital recordings available to the end-user. It is not a problem to equalize your acoustic system to a picture-perfect, ruler-flat FR (say, 1m on the axis, integrated over a sphere by an omnidirectional mic). This signal is supposed to be a linear-time-invariant (LTI) transformation of the digital recordings - but it is not. The differences from the LTI are what FSAF sees as distortions. Does this explanation suffice?

I guess 5 years old is my level, since @dcibel made me understand lol
thanks to both
now this was very usefull, thanks
thanks to both
is not a problem to equalize your acoustic system to a picture-perfect, ruler-flat FR (say, 1m on the axis, integrated over a sphere by an omnidirectional mic). This signal is supposed to be a linear-time-invariant (LTI) transformation of the digital recordings - but it is not. The differences from the LTI are what FSAF sees as distortions. Does this explanation suffice?
now this was very usefull, thanks
"misuse and abuse" is exactly what I am looking for.
I think I could be this guy.
Can impulses be used as a source? My first idea for a misuse would be to hear my room reverberation isolated
John, if the FSAF measurement was done from a file, what would the TD+N distortion graph show, the sum of all distortions plus noise? If the signal received by the microphone differs from the file, how can I highlight this difference on the graph? Maybe the TD+N graph is the difference graph?
Distortion graph for FSAF is a spectrum of the residual. So its total distortion + noise for the duration of the audio, regardless of what the input audio is. For more detailed analysis, listen to the residual audio, and/or "load FSAF residual", then view in spectrogram.
user44455555
Registered
- Joined
- Jan 16, 2021
- Posts
- 319
I try FSAF measure with some speakers.the only that get a correct FR was the ESI unik 05. i do this several times. only when i try measure bass port on back it fail. the other speakers get strange FR and very bad FSAF audio and 100% distortion. I have microphone 20 cm away measure on stative. I test the speakers on 2 cm basotect or on table or styropur. only ESI can measure.
the kali LP6 have a front bassport the ESI a back bassport. I test also a Yamaha HS5 it have back bassport. it fail too. here is a drumtest file and measure data
the drumtest audio file is -6 dbfs but it is show as +2 db in REW measure. a distortion warning during measure not happen
the drumtest file show resonance problems of speakers. also the ESi have alot.
the noise floor is only a little lower as TD+N and follow the curve. but when hear the audio, the residual audio the ring out resonances can clear hear. they sound on diffrent tom frequency near same.
Wy have the other speakers problems to get a correct FR ? . i try diffrent volume, does not help. the only diffrence to other speakers the ESI have a ribbon tweeter

the kali LP6 have a front bassport the ESI a back bassport. I test also a Yamaha HS5 it have back bassport. it fail too. here is a drumtest file and measure data
the drumtest audio file is -6 dbfs but it is show as +2 db in REW measure. a distortion warning during measure not happen
the drumtest file show resonance problems of speakers. also the ESi have alot.
the noise floor is only a little lower as TD+N and follow the curve. but when hear the audio, the residual audio the ring out resonances can clear hear. they sound on diffrent tom frequency near same.
Wy have the other speakers problems to get a correct FR ? . i try diffrent volume, does not help. the only diffrence to other speakers the ESI have a ribbon tweeter
Attachments
Last edited:
The +2dB and 2cm look ... interesting. I suspect that the setup goes to saturation somewhere.
To diagnose the problem, I need to see the .wav that has been sent to the speaker and the .wav recorded from the microphone.
The drumtest.wav by itself is ok. On my setup, FSAF converges fine. Yet, I would advise shortening the intra-bit intervals by 3x because, on average, the RMS is -35dBFS.
To diagnose the problem, I need to see the .wav that has been sent to the speaker and the .wav recorded from the microphone.
The drumtest.wav by itself is ok. On my setup, FSAF converges fine. Yet, I would advise shortening the intra-bit intervals by 3x because, on average, the RMS is -35dBFS.
user44455555
Registered
- Joined
- Jan 16, 2021
- Posts
- 319
The +2dB and 2cm look ... interesting. I suspect that the setup goes to saturation somewhere.
To diagnose the problem, I need to see the .wav that has been sent to the speaker and the .wav recorded from the microphone.
The drumtest.wav by itself is ok. On my setup, FSAF converges fine. Yet, I would advise shortening the intra-bit intervals by 3x because, on average, the RMS is -35dBFS.
The wav send to speaker is drumtest. how can i get the wav that is record from microphone ?. i can save FSAF residual (attached) but is it usefull in a failure measure ?
what do you mean with shortening the intra bit intervals by 3 ? . I test more and it seem there is a synchronisation problem, that happen not with ribbon tweeter. I can use very much diffrent distance which cause diffrent volume on microphone form the ESI speaker. result is near same and no warning from REW happen. When i use my other speakers which have no ribbon, often happen distortet or too low warning from REW. Wy is this so sensible on Dome tweeter ?. or the tweeter need send 24 khz in 48 khz sample rate ?. the esi tweeter do 25 khz so can work with 48 khz 24 khz sync tone., other do less. maybe loopback work better ? . normal measure with timing reference work always good doesnt matter if ribbon or Dome tweeter. maybe use 48 khz sample rate and 3 samples 16 khz or 4 samples 12 khz as reference signal is good enough ?
Attachments
Last edited:
1. The .wav REW sends to the speaker can be amplified by 8dB, and some high-freq noise can be added.
2. I do not know how to get mic file. Other people on the forum surely know that.
3. The FSAF residual you attached sounds like FSAF did not do much.
4. The drum sounds are about 1 sec long. If you start the next drum at 0.3 sec, overlapped with the tail of the previous, and so on, you'll increase signal density 3x, and the average RMS will go to a more sensible -25dBFS
Would you mind if we restart the debugging process, return to the point where everything works as expected, and then make one change at a time?
2. I do not know how to get mic file. Other people on the forum surely know that.
3. The FSAF residual you attached sounds like FSAF did not do much.
4. The drum sounds are about 1 sec long. If you start the next drum at 0.3 sec, overlapped with the tail of the previous, and so on, you'll increase signal density 3x, and the average RMS will go to a more sensible -25dBFS
Would you mind if we restart the debugging process, return to the point where everything works as expected, and then make one change at a time?
user44455555
Registered
- Joined
- Jan 16, 2021
- Posts
- 319
Would you mind if we restart the debugging process, return to the point where everything works as expected, and then make one change at a time?
with the ESI unik 05+ and ribbon tweeter it work good when measure no bassport or too near. . the others and dome tweeter work not. to avoid room influence and test speakers and noise of bassports very near use the tweeter for reference do in general not work
REW is able to do that. Why can't we just use a hardware acoustic loopback connection (e.g., using a physical cable on Channel 1 as a timing reference) for FSAF measurements to be able completely bypass the high-frequency synchronization pulses over the air?. this is most precise
On the apollo solo can do a loopback very easy and many other can do this too, because they have all outputs available as inputs too. i use mon R as output for timing reference. and Mon R as input for Loopback input in REW settings
EDIT: i have attach more burst Test files. i use with scope to compare and a basstest and a drumtest 2 which also contain high hat. it is done with ezdrummer 3 and ezbass. this get very high distortion also with the ESI. I think there is problem with sync also on ESI and maybe loopback can give better results ? the burst test frequency fit to 48 khz so no window is need
In the sweep mode in REW measure can choose

In FSAF is no choose for loopback
Attachments
Last edited:
user44455555
Registered
- Joined
- Jan 16, 2021
- Posts
- 319
here i do burst measure of 96 hz sine tone. distortion of harmonics look very high. because distortion on 96 hz is very low, seem SNR is good. i also attach the recorded wav. the input data burst is in above burst test.zip
I move the microphone 20 cm lower but the 2. harmonic at 192 % always stay over 50% distortion. normaly ringout and distortion should happen at 70 hz this show also a scope.
I ask the google AI about that, the AI tell FSAF use a adaptive filter. I did not understand wy. when i want see the diffrence is it not possible that the algorithm shift the recordet wave so long until the distortion between input and output reach fewest level. then align is best. then can calc the correct diffrences. this method also need no time reference signal

this is the recordet wav of a 96 hz single cycle burst. you see there is only very few high freq noise, so the result FASF output look not correct
I move the microphone 20 cm lower but the 2. harmonic at 192 % always stay over 50% distortion. normaly ringout and distortion should happen at 70 hz this show also a scope.
I ask the google AI about that, the AI tell FSAF use a adaptive filter. I did not understand wy. when i want see the diffrence is it not possible that the algorithm shift the recordet wave so long until the distortion between input and output reach fewest level. then align is best. then can calc the correct diffrences. this method also need no time reference signal
this is the recordet wav of a 96 hz single cycle burst. you see there is only very few high freq noise, so the result FASF output look not correct
Attachments
Last edited:
John Mulcahy
REW Author
Thread Starter
- Joined
- Apr 3, 2017
- Posts
- 9,589
how can i get the wav that is record from microphone ?

user44455555
Registered
- Joined
- Jan 16, 2021
- Posts
- 319
how i can see easy which measure it is. ? there are only such numbers. I use newest beta 133

user44455555
Registered
- Joined
- Jan 16, 2021
- Posts
- 319
here is FSAF measure and 200 hz burst waveform view and i use lower level. SNR also good, now high distortions begin at 400 hz.
but good is that REW can now show easy the waveform of a burst. maybe this help that speaker developers and reviewers can build or see speakers that have faster rise time. every speaker i have did have in 1. half cycle less than 50% of level it should have.

the burst i create with generator and save it as repeatable long wave.

and here is table which frequency fit to sample rate 48 khz so the burst have exact 0 at beginning and end create from AI
====================================================================
REW GENERATOR RASTER (Samplerate: 48.000 Hz / 48 kHz)
====================================================================
Gewünschte Anzahl Samples Passt in REW Physik-Status /
Frequenz(Hz) pro 1 Cycle (0.5Hz Schritt) Test-Anwendung
--------------------------------------------------------------------
40.0 Hz 1200 Samples JA (glatt) Tiefster Subbass-Test
48.0 Hz 1000 Samples JA (glatt) Nahe an Focal-Resonanz
50.0 Hz 960 Samples JA (glatt) Perfekt für ESI-Check
60.0 Hz 800 Samples JA (glatt) Klassischer Kick-Punch
75.0 Hz 640 Samples JA (glatt) Nahe an JBL-Tuning
80.0 Hz 600 Samples JA (glatt) Oberbass-Punch
96.0 Hz 500 Samples JA (glatt)
120.0 Hz 400 Samples JA (glatt) Kickdrum-Oberton
150.0 Hz 320 Samples JA (glatt) Kritischer Grundton
160.0 Hz 300 Samples JA (glatt) Snare-Punch-Bereich
200.0 Hz 240 Samples JA (glatt) E-Gitarren-Mute-Kern
240.0 Hz 200 Samples JA (glatt) Absolut sauberer Teiler
300.0 Hz 160 Samples JA (glatt) Höchste Port-Grenze
400.0 Hz 120 Samples JA (glatt) Unterer Mittelton
480.0 Hz 100 Samples JA (glatt) Extrem sauberer Teiler
600.0 Hz 80 Samples JA (glatt) Mittlere Frequenzen
800.0 Hz 60 Samples JA (glatt) Übergang zum Hochtöner
960.0 Hz 50 Samples JA (glatt) Exakter Teiler
1200.0 Hz 40 Samples JA (glatt) Hochton-Testgrenze
2400.0 Hz 20 Samples JA (glatt) 1-Cycle-Hochton-Trick
4800.0 Hz 10 Samples JA (glatt) Perfektes Sample-Raster
I have do also a 200 hz FSAF AKG 712 headphone measure using same microphone as speakers and stative to bring microphone 2 cm near headphone. burst have low volume but look much better (faster) as the speakers.
this is a not professional headphone measure, but results look great in wav display only


but good is that REW can now show easy the waveform of a burst. maybe this help that speaker developers and reviewers can build or see speakers that have faster rise time. every speaker i have did have in 1. half cycle less than 50% of level it should have.
the burst i create with generator and save it as repeatable long wave.
and here is table which frequency fit to sample rate 48 khz so the burst have exact 0 at beginning and end create from AI
====================================================================
REW GENERATOR RASTER (Samplerate: 48.000 Hz / 48 kHz)
====================================================================
Gewünschte Anzahl Samples Passt in REW Physik-Status /
Frequenz(Hz) pro 1 Cycle (0.5Hz Schritt) Test-Anwendung
--------------------------------------------------------------------
40.0 Hz 1200 Samples JA (glatt) Tiefster Subbass-Test
48.0 Hz 1000 Samples JA (glatt) Nahe an Focal-Resonanz
50.0 Hz 960 Samples JA (glatt) Perfekt für ESI-Check
60.0 Hz 800 Samples JA (glatt) Klassischer Kick-Punch
75.0 Hz 640 Samples JA (glatt) Nahe an JBL-Tuning
80.0 Hz 600 Samples JA (glatt) Oberbass-Punch
96.0 Hz 500 Samples JA (glatt)
120.0 Hz 400 Samples JA (glatt) Kickdrum-Oberton
150.0 Hz 320 Samples JA (glatt) Kritischer Grundton
160.0 Hz 300 Samples JA (glatt) Snare-Punch-Bereich
200.0 Hz 240 Samples JA (glatt) E-Gitarren-Mute-Kern
240.0 Hz 200 Samples JA (glatt) Absolut sauberer Teiler
300.0 Hz 160 Samples JA (glatt) Höchste Port-Grenze
400.0 Hz 120 Samples JA (glatt) Unterer Mittelton
480.0 Hz 100 Samples JA (glatt) Extrem sauberer Teiler
600.0 Hz 80 Samples JA (glatt) Mittlere Frequenzen
800.0 Hz 60 Samples JA (glatt) Übergang zum Hochtöner
960.0 Hz 50 Samples JA (glatt) Exakter Teiler
1200.0 Hz 40 Samples JA (glatt) Hochton-Testgrenze
2400.0 Hz 20 Samples JA (glatt) 1-Cycle-Hochton-Trick
4800.0 Hz 10 Samples JA (glatt) Perfektes Sample-Raster
I have do also a 200 hz FSAF AKG 712 headphone measure using same microphone as speakers and stative to bring microphone 2 cm near headphone. burst have low volume but look much better (faster) as the speakers.
this is a not professional headphone measure, but results look great in wav display only
Last edited:
John Mulcahy
REW Author
Thread Starter
- Joined
- Apr 3, 2017
- Posts
- 9,589
The number is the UUID for the measurement, which you can see on the Info panel.how i can see easy which measure it is. ?
Please let me know if I am mistaken about your setup:
1. You have an Apollo Solo audio interface,
2. which operates in USB asynchronous mode, i.e., uses its own clock as the master clock for both in and out
3. You have several speakers, one of them "ESI uniK 05+"
4. You have several measurement microphones ... Which ones?
5. You have calibrated your setup as REW prescribes.
Then:
1. Could you please put a known-good speaker and the microphone in the XYZ center of the room, 31.6cm apart, with no reflective surfaces nearby?
2. Use Sweep as excitation, save the spk, mic, and LTI response files
3. Use brown (or pink) noise as excitation for FSAF; save spk, mic, and residual files.
4. Please send me the files.
[John, please correct me if I am missing something] Yes, there are (were, will be) quite a few problems with Windows audio. One is that Windows adds unpredictable random delays in the chain. A way to deal with them is to loopback R out into R in, and use special markers / perfect sequences / ML sequences / etc for estimating these Windows-generated delays.
There are also problems when people use non-synchronized devices for spk and mic, but this is not your case, correct?
1. You have an Apollo Solo audio interface,
2. which operates in USB asynchronous mode, i.e., uses its own clock as the master clock for both in and out
3. You have several speakers, one of them "ESI uniK 05+"
4. You have several measurement microphones ... Which ones?
5. You have calibrated your setup as REW prescribes.
Then:
1. Could you please put a known-good speaker and the microphone in the XYZ center of the room, 31.6cm apart, with no reflective surfaces nearby?
2. Use Sweep as excitation, save the spk, mic, and LTI response files
3. Use brown (or pink) noise as excitation for FSAF; save spk, mic, and residual files.
4. Please send me the files.
[John, please correct me if I am missing something] Yes, there are (were, will be) quite a few problems with Windows audio. One is that Windows adds unpredictable random delays in the chain. A way to deal with them is to loopback R out into R in, and use special markers / perfect sequences / ML sequences / etc for estimating these Windows-generated delays.
There are also problems when people use non-synchronized devices for spk and mic, but this is not your case, correct?
Is the "timing markers" option enabled? I believe this is intended to correct for the unpredictable delays in windows audio. In any case, EXCL or ASIO is what I'd recommend.
It looks like user### is using some drum samples as test stimulus, which have a fair bit of "Dead air" and don't excite the entire audio spectrum. I'm not sure there is a problem, other than viewing the distortion spectrum as a normalized result. In a normalized view, distortion is expected to be high if there in areas where there is little to no excitation, as the residual will be dominated by the noise floor. Change Y axis scale to SPL and enable the "noise floor" check box may shed a bit more light as to what is going on.
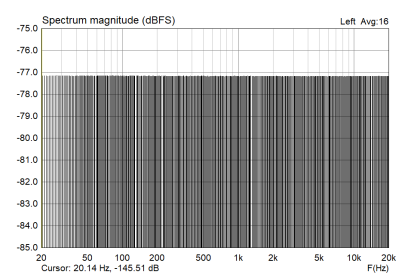
For 96Hz burst file, here is the spectrum of the stimulus. Given this stimulus, I think the only error is the interpretation of the measurement result.

I think it's best to validate the measurement setup before getting too carried away with your specific use case. Start by saving pink noise to WAV from REW generator and use that as the stimulus. Run a loopback measurement with your audio interface, confirm a normal low noise and distortion result, then repeat with a measurement through speaker and microphone.
It looks like user### is using some drum samples as test stimulus, which have a fair bit of "Dead air" and don't excite the entire audio spectrum. I'm not sure there is a problem, other than viewing the distortion spectrum as a normalized result. In a normalized view, distortion is expected to be high if there in areas where there is little to no excitation, as the residual will be dominated by the noise floor. Change Y axis scale to SPL and enable the "noise floor" check box may shed a bit more light as to what is going on.
For 96Hz burst file, here is the spectrum of the stimulus. Given this stimulus, I think the only error is the interpretation of the measurement result.
I think it's best to validate the measurement setup before getting too carried away with your specific use case. Start by saving pink noise to WAV from REW generator and use that as the stimulus. Run a loopback measurement with your audio interface, confirm a normal low noise and distortion result, then repeat with a measurement through speaker and microphone.
Last edited:
The other thing to note is that REW distortion tab for FSAF shows very limited information. It's just the spectrum of the entire recording. For a detailed analysis, open the distortion controls, listen to the residual, as well as select "load FSAF residual", then go to the spectrogram tab to view the spectrum over time.
@John Mulcahy, as a feature request, it would be absolutely amazing if one could go straight to the spectrogram tab to view the residual without the extra step to load the residual as a new measurement.
@John Mulcahy, as a feature request, it would be absolutely amazing if one could go straight to the spectrogram tab to view the residual without the extra step to load the residual as a new measurement.




Popular tags
20th century fox
4k blu-ray
4k uhd
4k ultrahd
action
adventure
animated
animation
bass
blu-ray
calibration
comedy
comics
denon
dirac
dirac live
disney
dolby atmos
drama
fantasy
hdmi 2.1
home theater
horror
kaleidescape
klipsch
lionsgate
marantz
movies
onkyo
paramount
pioneer
rew
romance
sci-fi
scream factory
shout factory
sony
stormaudio
subwoofer
svs
terror
thriller
uhd
ultrahd
ultrahd 4k
universal
value electronics
warner
warner brothers
well go usa