


-
AUDIO VIDEO PROCESSING, SETUP & ENVIRONMENTOfficial REW (Room EQ Wizard) Support Forum Audiolense User Forum Calibration Equipment Auto-EQ Platforms / Immersive Audio Codecs Video Display Technologies / Calibration AV System Setup and Support Listening Room / Home Theater Build Projects Room Acoustics and Treatments AV Showcase Movies / Music / TV / Streaming
-
AUDIO VIDEO DISCUSSION / EQUIPMENTHome Theater / Audio and Video - Misc Topics Essence For Hi Res Audio AV Equipment Advice and Pricing Awesome Deals and Budget AV Equipment AV Receivers / Processors / Amps UHD / Blu-ray / CD Players / Streaming Devices Two Channel Hi-Fi Equipment DIY Audio Projects Computer Systems - HTPC / Gaming HD and UHD Flat Screen Displays Projectors and Projection Screens AV Accessories Buy - Sell - Trade
Navigation
Install the app
How to install the app on iOS
Follow along with the video below to see how to install our site as a web app on your home screen.
Note: This feature may not be available in some browsers.
More options
You are using an out of date browser. It may not display this or other websites correctly.
You should upgrade or use an alternative browser.
You should upgrade or use an alternative browser.
V5.20.14 early access build
- Thread starter John Mulcahy
- Start date

- Status
- Not open for further replies.
GERONIMO.USMC
Member
- Joined
- Dec 2, 2018
- Posts
- 9
@John Mulcahy
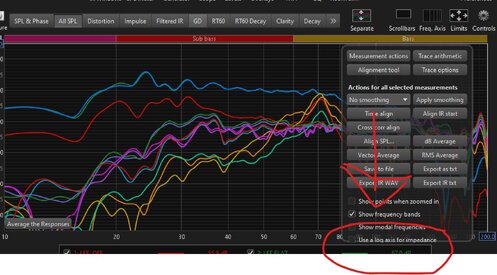
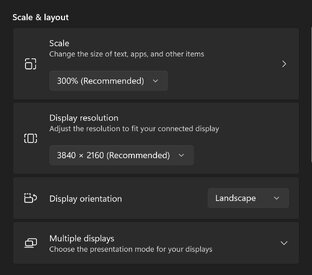
Hi. I've noticed this box rendering error under All SPL for awhile across builds on my desktop, but they have been fine on my laptop. Both run the latest Win 11 builds, 22621.963.
My display settings are attached and I'm running at 120Hz refresh rate.
Hi. I've noticed this box rendering error under All SPL for awhile across builds on my desktop, but they have been fine on my laptop. Both run the latest Win 11 builds, 22621.963.
My display settings are attached and I'm running at 120Hz refresh rate.
Attachments
Last edited:
John Mulcahy
REW Author
Thread Starter
- Joined
- Apr 3, 2017
- Posts
- 9,441
The difficulty is with the screen scaling, at 300% the effective resolution of the screen is only 1280 x 720, so there is very little vertical height available. That can be helped a little by going to the View preferences and unticking "Show toolbar text labels" and "Show graph button text labels". If that isn't enough you can untick "Show toolbar". Or reduce the screen scaling a little if the text stays readable for you at lower scaling.
Hi @John Mulcahy ,
Kimmo, the VituixCAD developer, has indicated some timing problems with "loopback with merge IR" when there is a long timing delay between loopback and measured signal of >3ms. Please have a look at the VituixCAD thread, link to start of relevant discussion is below:
Kimmo, the VituixCAD developer, has indicated some timing problems with "loopback with merge IR" when there is a long timing delay between loopback and measured signal of >3ms. Please have a look at the VituixCAD thread, link to start of relevant discussion is below:
VituixCAD v2 - HTGuide Forum
For information, VituixCAD speaker simulator has been updated from version 1.1 to 2.0 with the following additions and changes (so far): Crossover schematic changed from formal block ladder to free form supporting unconventional topologies. Predefined passive blocks replaced with individual...
www.htguide.com
Last edited:
@John Mulcahy
Sometimes, This issue occurs when i try to save using the capture function in Spectrogram or Waterfall. (Other graphs are certain, but I don't think I experienced any errors.)

I copied the error image and the error details in the notepad and attached it.
Sometimes, This issue occurs when i try to save using the capture function in Spectrogram or Waterfall. (Other graphs are certain, but I don't think I experienced any errors.)
I copied the error image and the error details in the notepad and attached it.
Attachments
John Mulcahy
REW Author
Thread Starter
- Joined
- Apr 3, 2017
- Posts
- 9,441
Thanks, I have fixed that for the next build. In the meantime just untick "Include title".
John Mulcahy
REW Author
Thread Starter
- Joined
- Apr 3, 2017
- Posts
- 9,441
Builds updated with these changes:
- Changed: Merging cal data into the IR takes account of the "Limit cal boost to 20 dB" Analysis preference setting
- Fixed: Merging cal with IR when using loopback as cal ref would give incorrect IR position if the left window was shorter than the measurement delay
- Fixed: Capturing an image of the waterfall or spectrogram graphs with "Include title" selected would cause an IllegalArgumentException
Hi John,Builds updated with these changes:
- Changed: Merging cal data into the IR takes account of the "Limit cal boost to 20 dB" Analysis preference setting
- Fixed: Merging cal with IR when using loopback as cal ref would give incorrect IR position if the left window was shorter than the measurement delay
- Fixed: Capturing an image of the waterfall or spectrogram graphs with "Include title" selected would cause an IllegalArgumentException
There is still some problem with a pre-application of windowing to the measured impulse, when using "merge loopback response to IR" is used. I think this is most easily observed by simply measuring background noise (speaker disconnected) and then normalizing the IR level to show the high noise.
Here we have the impulse response of the entire measurement, if "make calibration data from loopback response" is used:

And the same measurement, if "merge loopback response to IR" is used. You can see, the default window as been pre-applied to the measured IR. This is detrimental if I change the default window settings to something like 4ms right window.
John Mulcahy
REW Author
Thread Starter
- Joined
- Apr 3, 2017
- Posts
- 9,441
That is how it is intended to work. All arithmetic operations use the windowed IR.
Arithmetic for "merge loopback response to IR" when measuring should use the entire measurement length, not whatever the default window setting is, please. I would like to apply the window post-measurement, or at least be able to adjust it if needed when using this measurement method.
Last edited:
John Mulcahy
REW Author
Thread Starter
- Joined
- Apr 3, 2017
- Posts
- 9,441
I'll change it for the next build.
John Mulcahy
REW Author
Thread Starter
- Joined
- Apr 3, 2017
- Posts
- 9,441
Builds updated today with these changes:
- Added: An indicator ("T") at the bottom of the impulse graph shows the position of the timing reference when the measurement was made (only for measurements made after this build)
- Added: Noise floor capture before a sweep measurement is now optional, controlled by a check box on the Measure dialog. Capturing the noise floor takes about 1.4 seconds.
- Changed: Minimum frequency for waterfalls and spectrograms is now the axis start frequency set in the View preferences rather than 10 Hz
- Changed: Merging cal data into the IR uses the whole IR rather than the windowed span
- Changed: If "continue anyway" is selected when REW prompts about the measurement input not having SPL calibration REW will not ask in future for that input device.
- Fixed: The signal generator waveform preview might not show a clipping warning when signal peaks exceeded full scale until the signal was played, though the level display would show peak above 0 dBFS
- Fixed: The sweep dither preamble started playing before noise floor capture had finished
- Fixed: Trace arithmetic, vector average and cross correlation alignment would fail if the responses were entirely in negative time
Thank you John. I've only had 1 minute to test before I head to work this morning, but it looks very promisingChanged: Merging cal data into the IR uses the whole IR rather than the windowed span
")
John Mulcahy
REW Author
Thread Starter
- Joined
- Apr 3, 2017
- Posts
- 9,441
Can you provide a little more information? What is your test signal, what is the signal path, what does the spectrum look like, does the spectrum change if you change the setting?"Treat 32-bit data as 24-bit" seems to no longer work for me. I'm getting low level harmonics artifacts.
onlyoneme
New Member
- Joined
- Jan 18, 2023
- Posts
- 38
Sure. 1k sine played over toslink to RME ADI-2, RTA capture via USB.Can you provide a little more information? What is your test signal, what is the signal path, what does the spectrum look like, does the spectrum change if you change the setting?
Before, with mentioned setting enabled:

Now, regardless of that setting:
John Mulcahy
REW Author
Thread Starter
- Joined
- Apr 3, 2017
- Posts
- 9,441
What sample formats are shown at the bottom left of the REW main window?
onlyoneme
New Member
- Joined
- Jan 18, 2023
- Posts
- 38
Int32L in and out.What sample formats are shown at the bottom left of the REW main window?
John Mulcahy
REW Author
Thread Starter
- Joined
- Apr 3, 2017
- Posts
- 9,441
Odd, not something I see using the ASIO Madiface driver and an ADI-2 Pro with its internal loopback. Which 5.20.14 build are you running and what dither is being applied to the generated signal?
onlyoneme
New Member
- Joined
- Jan 18, 2023
- Posts
- 38
Latest one, ea25. I have 24 bit dither applied.Odd, not something I see using the ASIO Madiface driver and an ADI-2 Pro with its internal loopback. Which 5.20.14 build are you running and what dither is being applied to the generated signal?
Edit: I'm getting different results when using an old wav file and the one generated by the current build with the same parameters.
Last edited:

John Mulcahy
REW Author
Thread Starter
- Joined
- Apr 3, 2017
- Posts
- 9,441
Just seen your edit, you are seeing differences with wav files generated from different versions rather than live data. That will likely be a result of this fix in ea16:
Fixed: WAV files dropped on the RTA could show artefacts at around -162 dB
There was an error in the way received data was scaled that could cause quantisation artefacts. It wouldn't occur with REW's own files, as there was a complementary error on the output side, but could occur with files generated by other applications.
onlyoneme
New Member
- Joined
- Jan 18, 2023
- Posts
- 38
Hmmm... but those older files were generated by REW, ver. 5.20.13 probably. And it wasn't loaded into RTA, it was a live measurement using the file generated by the older build.Just seen your edit, you are seeing differences with wav files generated from different versions rather than live data. That will likely be a result of this fix in ea16:
Fixed: WAV files dropped on the RTA could show artefacts at around -162 dB
There was an error in the way received data was scaled that could cause quantisation artefacts. It wouldn't occur with REW's own files, as there was a complementary error on the output side, but could occur with files generated by other applications.
And what about "Treat 32-bit data as 24-bit" setting with the current build? How it is supposed to work? Previously it could handle those strange artifacts.
John, hello. On the ALL SPL tab, I need to move one of the graphs up or down. I can only do this if the vertical axis is SPL. With other units of measurement, the numbers in the Measurement actions window change, but the graph selected in the same window does not move. That is how it should be?
Last edited:
- Status
- Not open for further replies.


Popular tags
20th century fox
4k blu-ray
4k uhd
4k ultrahd
action
adventure
animated
animation
bass
blu-ray
calibration
comedy
comics
denon
dirac
dirac live
disney
dolby atmos
drama
fantasy
hdmi 2.1
home theater
horror
kaleidescape
klipsch
lionsgate
marantz
movies
onkyo
paramount
pioneer
rew
romance
sci-fi
scream factory
shout factory
sony
stormaudio
subwoofer
svs
terror
thriller
uhd
ultrahd
ultrahd 4k
universal
value electronics
warner
warner brothers
well go usa