Some guides to REW and acoustic measurement

John Mulcahy

REW Author
Thread Starter
Joined
Apr 3, 2017
Messages
7,212
During the check level test, I am not able to have the input meter read -18 dbFS without getting feedback
You have to set up the interface so there is no monitoring, the input must not be mixed back into the output. The only signal going to the output should be from REW.
 

AustinJerry

Member
Joined
Jun 5, 2017
Messages
216
Is that possible to generate average spectrogram from multiple measurements?

Well, you can generate an average of several measurements, and then show the Spectrogram of the averaged measurement. Not sure why you would want to do this. What do you think the spectrogram of several averaged measurements tell you?
 

Desmond74

Registered
Joined
Oct 1, 2020
Messages
5
Well, you can generate an average of several measurements, and then show the Spectrogram of the averaged measurement. Not sure why you would want to do this. What do you think the spectrogram of several averaged measurements tell you?
I can generate an average of several measurements, but can't generate spectrogram from that average of several measurements. The "Generate" button is grey out.
 

AustinJerry

Member
Joined
Jun 5, 2017
Messages
216
I can generate an average of several measurements, but can't generate spectrogram from that average of several measurements. The "Generate" button is grey out.

Well, I have to admit that I have never tried it. You didn't answer my question. What value would an averaged Spectrogram have? A Spectrogram shows bass resonances, which are standing waves. What would an average of stamding waves represent?
 

John Mulcahy

REW Author
Thread Starter
Joined
Apr 3, 2017
Messages
7,212
Is that possible to generate average spectrogram from multiple measurements?
You would need to make a vector average so that the result had an impulse response. If the measurements are made from different positions they should be time aligned or cross-correlation aligned first. Cross correlation alignment is a feature of the V5.20.14 early access builds.
 

Desmond74

Registered
Joined
Oct 1, 2020
Messages
5
Thanks John. I also found out that by generating minimum phase with the average trace, it will also have an impulse response, and being able to generate spectrogram.
How is that different to a vector average? And why is that multiple measurements from different position should be time align?
 

John Mulcahy

REW Author
Thread Starter
Joined
Apr 3, 2017
Messages
7,212
The minimum phase is, as it says, producing an impulse response which has the same magnitude response but whose phase is generated from the magnitude response using an assumption of minimum phase. Actual in-room responses are rarely minimum phase across their frequency span, so the spectrogram does not reflect the system that was measured. A vector average uses the measured data, but if the measurements are not time aligned there will be phase cancellations in the average due to their differing time delays.
 

giordy60

Registered
Joined
Nov 8, 2017
Messages
11
hi John
what is the latest release of REW usable on mac os big sur ?
thank you
 

giordy60

Registered
Joined
Nov 8, 2017
Messages
11
ok thanks, it's the release I already installed !
I thought there was one more recent
 

dcibel

Member
Joined
Sep 10, 2017
Messages
151
I've posted a short instruction on how to create a room response for setting up room EQ with REW. This uses the RTA and pink noise generator to create a room average measurement. This process is often referred to as the "moving mic" measurement method. Hopefully it can help someone new to room EQ and REW to get started.


DanDan

Moderator
Staff member
Joined
Mar 10, 2018
Messages
743
I've posted a short instruction on how to create a room response for setting up room EQ with REW. This uses the RTA and pink noise generator to create a room average measurement. This process is often referred to as the "moving mic" measurement method. Hopefully it can help someone new to room EQ and REW to get started.

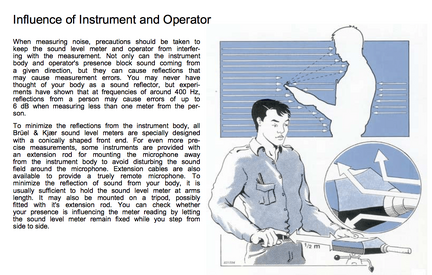
The Microphone would really need to be on a boom, hand held is really too close to the body.
 

Attachments

  • B&K Near the Mic.png
    B&K Near the Mic.png
    232.4 KB · Views: 23

dcibel

Member
Joined
Sep 10, 2017
Messages
151
@DanDan You will find that for in-room measurement with many averages, it doesn't matter much, not enough of a difference to influence your EQ results in a meaningful way anyway. Would you use a different EQ profile if you were listening with someone sitting next to you? Of course, you can test and verify with your own measurement results, it's a simple process to complete.

Here's a commonly referenced old video on the subject, FWIW:
 

dcibel

Member
Joined
Sep 10, 2017
Messages
151
For a quick comparison in my office, I plugged in a small bookshelf speaker and placed it on a small table. Compared the same measurement process holding the mic at the end of my arm, about 2ft from my body, to holding the mic at the end of a mic boom stick, about 4.5ft from my body.

No 6dB difference seen here, maybe 1dB though. I will probably make very similar EQ decisions with either of these measurements.
1681429003103.png
 

DanDan

Moderator
Staff member
Joined
Mar 10, 2018
Messages
743
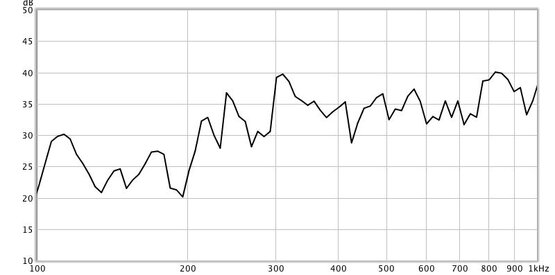
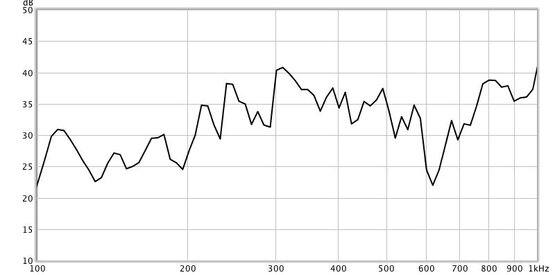
Vaya con dios dcibel. I will stick with best practice, Bruel and Kjaer. The original Moving Mic rigs had long booms. No serious Noise Measurements are done without Tripods or Mic Stands. No I would not measure and eq to compensate for a person sitting next to me. As I would not measure nor eq with a person near the mic. There is an obvious and well known problem with taking measurements with random obstructions as opposed to none. Even your own positionally biased test shows differences of up to 2dB over a large swathe of the spectrum. I cannot understand why MMC is advocated. It is clearly an inferior methodology. What is the attraction? Is it the speed of the measurement process?
A few weeks ago I did indeed try a quite measurement with a mic close and far from my body. I may have dumped the graphs which were really very different, albeit not at the frequency B&K state. You may have gotten the same results as myself and B&K if you had included close to your body. I don't think your test is a realistic simulation of what happens when somebody waves a mic about throughout the sweet spot. Dirac Live and many of us suggest sampling a minimum sweet spot of say 1.5M x 1M x 0.5M


EDIT - I found the graphs. Click on them, big issue around 600Hz
 

Attachments

  • Boom Stand.jpg
    Boom Stand.jpg
    25.3 KB · Views: 43
  • Close to Body.jpg
    Close to Body.jpg
    25.4 KB · Views: 39
Last edited:

dcibel

Member
Joined
Sep 10, 2017
Messages
151
What is the attraction? Is it the speed of the measurement process?
-its fast
-its easy
-its repeatable
-it's far better that single point measurement that many newcomers to REW complete.

Instruction is not intended to be the only way to measure a room, it does provide quick easy method to very good results. I compared to taking many measurements with mic on boom and running through vector averaging, and concluded that just as good results were achieved with RTA average in a fraction of the time. YMMV, so do whatever superior process that you like.
I don't think your test is a realistic simulation of what happens when somebody waves a mic about throughout the sweet spot.
But that's what I did. It wasn't a simulation though, it really happened.
 
Last edited:

DanDan

Moderator
Staff member
Joined
Mar 10, 2018
Messages
743
I just do the Science here. I think anyone will agree with the obvious. Mic on boom, moving or not, is simply better.
There is another factor. Audio has extended down to 20Hz these days. I don't trust a hand held sensor trying to hear audio only to be immune to physical movement noise.
My advice regarding measurement, and that of B&K and many decades of practice, say best practice is to keep the sensor well away from reflecting surfaces. Again, your own simple test shows differences of up to 2dB across a wide swathe of the audio spectrum. QED
 

dcibel

Member
Joined
Sep 10, 2017
Messages
151
Yeesh. It's just a simple comparison with a small computer speaker with 4" woofer.. purpose was to show real difference in 400Hz range far from 6dB. SPL was not high, possibly noise floor, possibly mic noise from being jostled. Operator can use brain on results, keep hands steady, don't tap on mic, jostle cables, jingle keys, etc while measuring. For real measurement keep SPL at decent level to maintain high SNR.

RTA measurement instruction updated with additional detail of holding steady while measuring, maintain decent SPL, and the option of using a boom stick to measure from a further distance..
 
Last edited:

dcibel

Member
Joined
Sep 10, 2017
Messages
151
Doing Science...from the B&K snippet "You can check whether your presence is influencing the meter reading by letting the sound level meter remain fixed while you step from side to side."

Here, same speaker, mic placed on boom stick, no averaging. Red trace is with me 6ft away from the mic standing against the back wall. I then took measurements at arms length as if I would be holding the mic, but without holding the mic, just extending my arm as a ruler stick. Now all can see the real difference, or measure it yourself at home and make your own conclusions.

My conclusion, better to stand to the side than behind. When completing in-room measurements, standing to the side waving the mic over my couch, standing behind would not be possible in many situations.

(it's the evening so SPL is low, you can assume <35Hz is noise floor)

1681619432574.png
 

DanDan

Moderator
Staff member
Joined
Mar 10, 2018
Messages
743
My graphs show a 10dB difference at 600Hz. Again, your own test showed that arms length caused variations of up to 2dB across a wide spectrum. Again, reality will be worse than that as arms length is not enough to cover a typical sweet spot of 1.5 x 1 x 0.5 Metres.
 

ddude003

AV Addict
Joined
Aug 13, 2017
Messages
1,403
Location
Somewhere Northeast of Kansas City Missouri
More  
Preamp, Processor or Receiver
PrimaLuna Dialogue Premium TubePre (2 channel+sub)
Main Amp
McIntosh MC152 SS Amp (2 channel)
Additional Amp
Yamaha RX-A850 Pro (the other 5 channels lol)
Computer Audio
MacBook Pro, Custom i7 7700k De-lid 2xAsus1080ti GFX Audirvana Studio, Hang Loose Convolver, Pulsar Massive & 8200, LiquidSonics, SoX
DAC
Chord Electronics Ltd. Qutest
Universal / Blu-ray / CD Player
Sony UBP-X700 /M Ultra HD 4K HDR & PS5
Front Speakers
Martin Logan ElectroMotion ESL
Center Channel Speaker
Martin Logan Motion C2
Surround Speakers
Martin Logan Motion 4
Surround Back Speakers
Martin Logan Motion 4 (yes, another set of these)
Subwoofers
Martin Logan Dynamo 700
Other Speakers or Equipment
Cifte 12AU7 NOS & Genalex Gold Lion Tubes in Pre
Video Display Device
Samsung The Premiere LSP7T UST Laser Projector
Screen
Elite Screens Aeon CLR3 0.8 Gain 103-inch
Remote Control
PrimaLuna, Lumin iApp, Samsung & Yamaha
Streaming Equipment
Netgear Nighthawk S8000 Streaming Switch, Lumin U1 Mini Streamer Transport
Streaming Subscriptions
QoBuz Studio Premier, Amazon Prime & Netflix
Other Equipment
ThrowRug, SaddleBlankets, WideBand & Bass Traps...
And then there is the issue with smoothing... I am sure with various smoothing methods one can make any measurement look better or worse...
I would say, post up .mdat files not screen shots or .jpegs...

Since I only have a small room with one place I, and my girl, usually sit for both stereo listening and/or Home Theater use, I always use a stationary microphone position... I don't really see the point of running around the room and doing a bunch of averages... And if I am up roaming around the room, I don't expect the best soundstage and resolution as I am no longer in the Main Listening Position(s) and most likely at very different distances from the main Left and Right speakers...
 
Last edited:
Top Bottom