I am new to REW and would like some advice about measuring a recording room. I have searched extensively but all the information seems to be about listening and mixing rooms. My understanding is that the same analyses should also make sense for recording rooms, but how would I set up the speaker and mic? If I for example want to find a good spot in the room for recording guitar, would I place my monitor-speaker at the spot where the guitar would be and the mic in front of it? does that make sense? Or does the position of the speaker not matter so much for this kind of measurement?
Different purposes, goals. In a listening room we hope to achieve an optimum response in a small area. At ultimate pro level, a bigger area, but practically speaking, even in such expensive surroundings, only a small sweet spot lies within the field of the monitor speakers. On the other hand, a recording room will typically be optimised for enhancing particular sounds. Ideally one might have a large room capable of being divided by giant gobos to accommodate full band or orchestra. Abbey Road. More practically and commonly, drums will have a room, piano, vocalist, all separate rooms. A drum room or indeed zone within a larger room, will have a different, opposite requirement, to a vocal spot or booth. Drums need reflections, vocal recordings are clearer with none. So by all means use a speaker and mic throughout the room to test responses. I would also encourage playing isolated multitrack sounds on the speaker and recording. Note though that resonant sources will react to room feedback but of course playback cannot. Also do a full modal map of the room by placing speaker in a tri corner, and mic in the opposing tricorner. It is extremely useful to know where the strongest peaks and dips and ringing are.
thanks for the quick reply. I'm talking strictly abourt home recording. I mainly record vocals and guitar and find it difficult to tell the difference between locations and various absorber-placements etc. But the speaker-and-mic-moving method makes sense? I will also try to do a modal map. Do you happen to have any hints where I can read up on this?
You are welcome. The speaker and mic thing is absolutely fine. It should show up trouble. But a knowledge of the likely and actually present modes and their strength will deliver certain no fly zones with minimal effort. e.g. Let's say we have an 8' ceiling, minimal or no treatment.
At 4' there will be a massive null around 73Hz, and a strong peak around 150Hz. A seated male vocalist will have his manhood removed and be turned into a Honky. Simply standing will radically improve his chances of finding a mate......
Eigenmodes, room modes can be nicely graphically predicted here https://www.hunecke.de/en/calculators/room-eigenmodes.html
But I would encourage an actual modal map. Place your speaker in a corner on the floor, mic opposite, ideally at the ceiling tricorner. REW sweeps, maybe try another corner while you are at it. Restrict the Waterfall plot to say 500Hz or whatever to highlight the long ridges ringing modes. Use the Signal Generator, Sine, Frequency follows cursor. Slide the cursor over the lowest, then walk the room. You will be stunned by the absolute null mid room and the chest massaging levels at the two walls supporting this mode. etc. Masking tape on the floor, or a full map. You will now know where the booms and dry spots are. Don't forget height.
There are now quite a few Apps which enable us to measure the acoustic properties of rooms and larger spaces.
This has led to many attempting to use it to evaluate their studio or other listening room. This can be confusing and disappointing, particularly as the Apps get more complex.
The aim of this paper is to offer a distilled basic understanding and the simplest route to getting up and running.
Measuring Software
The 60's brought the invention of Time Delay Spectrometry. For the first time we could properly see and measure sonic reflections on screen. The hardware units were expensive. But in time, the PC, Mac, and now Smartphones were harnessed by various developers. See Appendix 1 below for a full list of Apps.
For beginners, it can be helpful to avoid outboard interfaces. Onboard Line In/Out sound quality is absolutely good enough for the job at hand.
There are also integrated packages which both measure the room and generate corrective Eq filters. Dirac Live. Sonarworks. Minidsp and Trinnov offer hardware platforms. Many speaker and Hi Fi manufacturers have integrated such processes into their products. These systems have become known as Digital Room Correction, DRC, perhaps an overstated term. In domestic or pro-sumer inadequately treated rooms DRC can be extremely useful. It can make a bad situation workable, while in a good acoustic it can still enhance. An often overlooked but IMO over-riding benefit is the ability to chose and manipulate a Target/House Curve. Acoustically treated rooms have great resolution, like good headphones. But the direct sound paths unhampered by reflections generally sound way brighter than normal rooms. The ability to finely define a full spectrum Target Listening Curve simulating what real world listeners finally hear, has been a game-changer in my experience.
Impulse Response
Let's start with an idealised sound stimulus, i.e. all audio frequencies starting instantaneously and simultaneously. Balloons, handclaps, and starter pistols, have been used. Electronic stimulus is obviously more convenient and controllable. So we play a sine sweep from say 10Hz to 20KHz i.e. all audio frequencies of interest stated serially and slowly. While this plays, we record what is happening in the room.
Play and Record, what could possibly go wrong? The subsequent recording will contain all frequencies of interest, PLUS the combined responses of the room and speaker. Magically our software now virtually ’subtracts’ the sweep, leaving us with only the room + speaker response. We now have a map of what will happen to any sound played on those speakers in that room. An Impulse Response. These IR's are the same as those used in convolution reverbs. Indeed Arjan (Altiverb) explains the IR really well in his guided tour video. Perhaps a picture says it better. Here we see the idealised initial impulse, a single instantaneous spike of 0dBFS followed by reflections from nearby surfaces. The level and arrival time of these reflections show if they are welcome or not. In critical listening rooms, it is common to see all reflections within the first 20mS suppressed by at least 20dB. Here we see an IR Graph, but the Envelope Time Curve variant is most commonly used due to some advantages.
It might be useful to consider these as ‘Echographs’
The Microphone
The frequency response bumps of any reasonable mic are tiny compared to the 30dB anomalies we find in real rooms. Omni is necessary though because some of the acoustic action has direction. Jump in, get a demo of the software and go for it with whatever mic you have at hand, even built in iMacs, Laptops, Phones. In time, if you develop a liking for measurement, you may want a more suitable mic or software. Measurement mics are omnidirectional small diaphragm condensers. The best of these are optimised to have a very accurate and stable frequency response at all angles of incidence. This requires small capsules which can lead to poor signal to noise ratio. There are a couple which are flat and genuinely omni, and quiet enough for recording. e.g. DPA, EarthWorks. The HF response of all the commonly used cheap mics is dodgy. They are not flat and pointing them in spurious directions doesn't make them so. Thankfully most these days are suppled with Calibration Files in a standard text format. Measurement Apps can apply these individual corrections to flatten Frequency Response and as a bonus, read absolute SPL. Different Cal files are supplied for on axis 0 degrees, or 90 degrees pointing vertically up or down. The verticals are used when working on with Surround, point the mic at the ceiling or floor, whichever is less reflective. The mic will now hear the HF from all horizontal sources equally, but corrected to flat by the Cal file. Sound Level Meters are very useful in the studio and elsewhere. It is good to get a sense of what SPL numbers actually mean and sound like, e.g. 60dBA, or 90dBC Slow. However I absolutely do not recommend using the mic in any cheap SLM for measurement. The Frequency Response can be without LF due to HPF, unknown, or HF boosted. The self noise is usually awful, sometimes even including DC. Appendix 2 has a list of recommended measurement mics from iPhone to Lab standard. Mic Cal is always very welcome with the wildly varying cheap mics. But the tolerances of the best recording and measurement mics are very tight and IMO trustworthy. Other specs such as noise, distortion, headroom, phase, will all be much superior in high end mics. Many of these mics are equally well suited to very high quality recording.
Where Place the Mic
We frequently wish to test, change some location or other parameter, test again to observe improvement or not. To ensure the mic is at the same spot, I recommend hanging a small pointed weight from it. Adjust the length of the thread to so that the weight just barely touches the ground. Mark this spot on the ground using masking tape and label it. Perfect recall of mic location, including height.
Start with a single measurement exactly equidistant from both speakers. Locate the mic there using tape, thread, laser measure. We can now check if the speakers are delivering equally, bearing in mind of course that the room surroundings at each speaker may differ. Many of us have our own favourite methods of covering the sweet spot. I like to place the mic at the left ear position when measuring the left speaker , then the right ear and speaker. This IMO simulates a pair of listeners ears. One way or another measurements should be taken throughout the listening area which will be actually used, prioritising the Mix Engineer's spot unless of course we are in a Home Theatre or such. I recommend including variation of heights in the sampling process.
Calibration
Soundcard Calibration is often suggested, I guess for historic reasons, but I don’t think even the cheapest modern soundcard would have any significant frequency response variations. I see no need or purpose for SC Cal. For everyday purposes, I see no great call for Loopback Correction. Indeed neither are even possible with a USB Mic.
Level Calibration is similar to proper gain staging in recording. The aim here is to achieve healthy play and record levels and to have the in-App SPL meters represent actual levels. A real SLM can of course be used to Level Calibrate any mic/preamp/software setup. Place the SLM next to your mic. Play Pink noise and adjust the volume to some round figure on the SLM, say 80dB, C or Z, Slow. Now Calibrate the meter in your app to read the same. The absolute sensitivity of various USB mics is in the supplied Mic Cal files. REW in particular can recognise both Mic and File, causing the REW SPL meter to show actual levels. I have found some of these to be off a couple of dBs, similar to iPhone SLMs. No big and it can be corrected to perfect using a borrowed real SLM or Calibrator.
A Microphone Frequency Response Cal file adds and subtracts a few dB's here and there to directly counteract the measured variations of the actual mic in use. This renders the response effectively flat, transforming the generally unknown HF response of these mics into Laboratory grade flatness. There really is no point in buying a cheap measuring mic if it does not come with an individual Cal file.
Loopback Correction measures the response of a second record channel, including latency/delay. This enables the App to combine multiple sweeps which increases immunity to noise. It also enables graphs reading actual times of travel, e.g. reflections at actual times or distances from the speaker. So, if you are fully Calibrated, your mic and soundcard will become ruler flat and your graphs will read actual SPL and delay times. Nice, but as were are only really interested in very large variations, such absolute values are absolutely not necessary.
Take a Shot
Establish Playback. Select any output and connect it to a single speaker. Set the sweep to default or say 10-20,000Hz over at least a 10 second period. Start with the volume/monitor controller safely low. Hit measure and listen for the sweep. Try a series of sweeps with increasing levels. Watch for clip indicators on your amp or active monitor, particularly at HF. We want a moderately loud sweep but there is no advantage to very high levels. Let's try for around 75-dB (C/Z and Slow weightings). You may see peaks of up to say 85/90dB.
Now establish the input. Find an input level meter in the App. Tap and mic and you should see action on the meter but it should definitely not be audible on the speaker. That would be an acoustic feedback loop. If you do hear the tapping, it will be some form of ‘direct monitoring’. Mute it. Now play some measurement sweeps. Adjust the mic pre gain to get somewhere close to full scale on the input meter just like in normal audio recording. Note USB mics may have a 0dBFS level of 94dB. If you cannot get input or if the level is way off, look into Sound Preferences or Drivers in your OS. Set any available input level faders or settings to 0dB, nominal, or full on. After each trial sweep let's view an SPL graph. Expect big big peaks and troughs. When happy with the average levels appearing on these graphs, name and save your first measure. Sweep using L, R, and L+R. The latter is only useful to see what is happening at LF with the two running, as they will be. But ignore dual speaker measures above LF because it will have massive comb filtering everywhere except a precisely centred mic location.
Viewing
Our measure can now be viewed in many different ways on different graphs. Consider them as different lenses. The IR itself is not altered in any way by using these views and filters. Play with the controls, Zooming, Dragging, Smoothing, all of it. I have made my settings visible in all the graphs here…… hint hint. It is good to dip into the manual for the software now and then. The REW manual is an excellent read in any case. For Y axis levels try 94dB or 0dBFS for the top to correspond somewhat to the actual peak SPL of the sweep. Let’s say 40-45dB for the bottom to correspond to actual ambient room/machine noise. Smoothing, Zooming, and Frequency Span are all interactive on the X axis. For modal decay work try viewing 1000ms or even longer for untreated rooms, perhaps 3/500ms for treated. There are controls for 'windowing' but this is under the bonnet stuff, i.e. the automatic figures generally work. A full range Frequency Response graph will look crazy at the top end with no smoothing. Use 1/3 Octave or whatever you fancy to get a sense of perspective. This will remove the wild squiggles revealing the overall trend or tonality. No smoothing at all obviously reveals the most detail. This is useful when zoomed in to narrow ranges of frequency , e.g. the typical 20-300Hz LF range. Flat is not necessarily good. Many of us favour a House/Target listening curve, sloping downwards towards HF. Back in the 60’s Bruel and Kjaer measured the average home response, which turned out to have quite a tilt. About +3dB at LF falling to -3dB at HF. When listening in a virtually Anechoic Control Room, applying this average domestic curve causes good translation from CR to the home listener. Being there.
The Graphs
Frequency Response graphs hardly need an introduction here. But they do not necessarily show the most audible aspects of the acoustic. The ear is well used to adapting to different responses and tonalities. FR is a static measurement. But some software provides Real Time Analyser / Spectrum Graphs which can be used in conjunction with Pink Noise. This arrangement will give a FR graph which updates every second or so. This can be extremely useful for quickly finding optimum Listening or Speaker Positions. Play the Pink Noise, and simply walk about with the mic while viewing the RTA. Zoom to LF only and look for the places to avoid and eventually the most even response.
Music is a train of impulses, each of which stimulates the room's response. In real rooms, sound decays at different rates at different frequencies. LF decaying slowly can make it very hard to hear the pulse of music. HF lingering on can be harsh. There is a whole family of graphs all showing Room Decay in different ways. This is testimony to the fact that the length and spectrum of the room tone is just as destructive of fidelity as FR variations. We hear a sum of direct path from the speaker, plus the room tone. But note, close to speakers in a highly treated space, really only the direct sound exists.
Envelope Time Curve is a variation on viewing the Impulse Response graph directly. Both are very similar in that they show a pretty literal graphic representation of a hypothetical or real single Impulsive spike followed by a train of reflections from all the boundaries. When viewing, is useful to Normalise these ETC graphs to 0dBFS and to shift the initial spike to 0mS. Room Tone Decay Time can be derived from the slope of the ETC. The absolute level of reflections and their time of arrival after the direct are visible, an indication of how live the room is. Some Apps include the ability to view using 1/3 Octave filters. Note only single speaker measures should be viewed when looking for reflections.
T30 gives a fair indication of how long sound will carry on after the source is stopped. Even better is the specially created Topt in REW. Avoid EDT, T20 and such unless you have a knowing reason to go there. Reverberation Time, RT60, strictly speaking is not defined in small non diffuse rooms, but we use them anyway. The BBC required their regional studio Control Rooms to have third octave decays within 10% of each other. IMO a wise and powerful qualifier.
The Waterfall or Cumulative Spectral Decay is fairly self explanatory. It gives an easily understandable picture of a sound spectrum decaying over time. However the numbers are indicative only, decay times read directly off the graphs will be inaccurate.
There is also the Spectrogram which many favour when viewing LF decay.
These decay revealing graphs vividly show how modal resonance rings on. These modes cause individual bass notes to pop up loudly at particular places in the room, becoming virtually inaudible at other locations. These modal peaks and nulls are solidly located in the room. It is very useful to get to know where they are. A modal map if you will. There is another form of non resonant null caused by a single or small number of close hard boundaries near the speaker. Speaker Boundary Interference Response, SBIR with it’s trademark deep nulls. These nulls vary in frequency with different locations of speaker and listener. They appear as a void in the Frequency Response. This may exist for only for the first, say 50ms, then it may get filled in by blooming modes close in frequency. SBIR nulls caused by the Front or Side Walls, or the Floor, can be as deep as 30dB, entirely removing some bass notes, making LF mix decisions very unreliable.
As we are dealing with Decay our Y axis should show from the ambient noise floor, say 40dB, up to the Sweep SPLs, typically peaking around 95dB. Adjust the duration of the X axis to show the full extent modes tailing off into the noise floor of the room.
What to expect
Horrible looking graphs! Even the best Pro Studios don't publish their measurements because they are simply way too ugly. It takes an experienced brain to evaluate how a room sounds or errs. A lot more to figure what to do about it. Let’s not expect a health check and a treatment prescription from Software. We see many forum post with the same question, ‘how does my room look’. The answer is ‘squiggly’ or ‘wrong question’ These Apps are are just tools, not Room Doctors.
Conclusions
Impulse Response based measurement is very sophisticated. Simpler tools are sometimes just as useful. Pink Noise and a Real Time Analyser give instant results. Simply watch the Graph while moving the speaker or mic. Sine Waves are ideal for precisely finding modal hot spots suitable for LF treatment. REW has these tools built in. A friend, Bogic Petrovic, sadly RIP, created a really cool set of tone bursts which are ideal for stimulating rooms into ringing. It can be downloaded here. Impulsive Tones can be generated by voice. Newell and myself appreciate the usefulness of uttering tonal barks, honks, while investigating. One can tune exactly to problem frequencies where they are most problematic. Handclaps, Starting Pistols, Pillows, Stopwatches, Balloons, are all useful in the experienced hand. Analysis of the room, by whatever means, can be extremely useful, but it is not mandatory, nor a rite of passage, nor the magic path to audio bliss. A room treatment can often be prescribed by simply looking at it. Listening is helpful! A collection of Reference Tracks can become audio ‘home’ to the ear and brain. Knowing the sonic signature of these Refs, the response of the room and speakers is immediately obvious to the trained ear. I refer to this type of activity as Active listening. There is intent, learned sonic signature, comparison. On a similar note, we could passively look at our Graphs. Or we could become active, making physical changes and viewing the sonic results caused by them. e.g. Move a speaker 50mm, view the difference. I reckon this is the most useful aspect of the software. It shows improvement caused by changes and viewing the results visually. It would take a long time listening to be so sure of cause and effect.
Location Location Location
I believe it was Bob Hodas who said that optimising the speaker and listener locations is 70% of room treatment.
The following spectacular improvement from Red to Blue was accomplished by merely moving the speakers and listener to optimal positions.
DPA and and Earthworks and Gefell Omni Studio Mics are flat enough for measuring and quiet enough for recording. Note such premium brands have superior responses and specs. I believe they deliver better results in DRC applications.
Hello, thanks for the wonderful program!.
Given how many iterations of REW there have been, (not to mention the changes in operating software such as windows 7, 8, 10 etc since its inception) perhaps it's time to revisit and remove some of these setup guides that are circulating around which may no longer have relevant information since the data has changed. Most recently I am resetting everything to default settings on windows 10 to start fresh with REW and a Umik-1, and would like to find a guide that is accurate in 2021. I know that it's out there, the problem is that there are also so many guides that are no longer relevant still in circulation. This can be confusing to a newbie that is trying to adjust settings in the OS that no longer need to be adjusted just because he or she got stuck reading an older guide.
Hi, previously I manage to measure frequency above 10khz. not sure why the current measurement has significant roll off above 10khz. any pointers? I'm using USB UMM6 Daytonaudio mic. am I missing anything?
If the system has significant latency the end of the sweep might not be captured, use the acoustic timing reference to fix that. Otherwise if on Windows check that the default format in the Windows audio properties for the mic input has the correct sample rate.
If the system has significant latency the end of the sweep might not be captured, use the acoustic timing reference to fix that. Otherwise if on Windows check that the default format in the Windows audio properties for the mic input has the correct sample rate.
I found out is due to the default driver install for daytonaudio UMM6 mic on window 10 with latest laptop. this affect the default format and it limits the audio quality that the mic can record (16 bits and 16khz (Tape recording quality) or 16 bit 22khz). with little headroom it can only record upto 10khz. not sure how to solve this problem as I cannot download the right driver. sad.
Hello,
I am new REW. Its amazing to work with REW. Can anyone help how to test with the signals generated from "Signal Generator". I generated pink noise and sine wave which I want it to be as input for Measuring SPL. Under "Measure" Tab, I see this. Not sure how to test with other test signals
John,
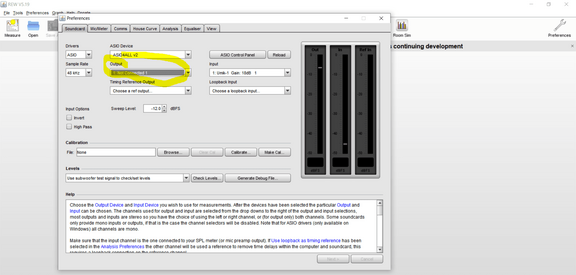
The AustinJerry's guide was a lot of help (sorry as I can't post the reply to this thread because this is my first posting...), but I don't know what happened, as I lost the output... At one point I lost the UMIK-1 and got that back, after closing REW and then opening back up, but the AVR won't populate in the output... It did show up earlier, but don't know what changed...
I only have so much time to play with REW, and hope someone can give me some input... TIA
Confirmed
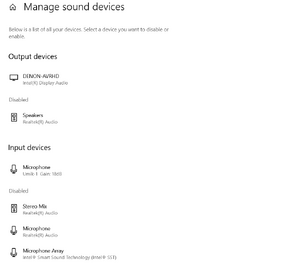
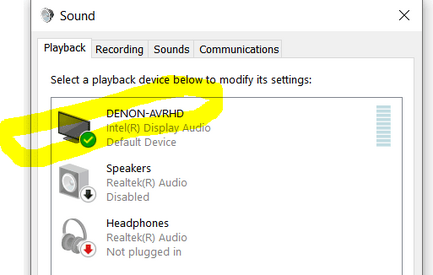
1) Win10 Laptop test sounds play over HDMI to AVR/Speakers
2) UMIK-1 enabled & shows on intput
3) AVR (Denon AVR-X4300H) shows up enabled on
I've done this 3 times with no change, and even after closing the app and opening back up. I'll attempt again when able, but no time today. Thx for the reply...
Clarification. On the AVR the HDMI 6 is selected and the port the HDMI cable to laptop being used. Should it make a difference whether the video out in auto or HDMI?
I'm not familiar with the AVR you have so can't comment on what its settings should be, but if there isn't a display connected ultimately receiving the HDMI signal you might get odd behaviour.
So I am doing some EQ for my subs in REW and I have a question, can I leave the Allow narrow filters below 200 Hz box checked? It seem I get a slightly better EQ reading when I leave this box checked, but I’m not certain if it will have a negative impact on my subs. Help please?
I have always left it checked and get great results. If you are not already doing so, I would suggest using the RTA function with the "Moving Mic" method. This technique has been thoroughly tested and works much better than multiple fixed microphones when delay issues are not being done. Single point sine measurements are still required for that.
With regards to EQ, unfortunately the "Q" of filters from different sources are rarely the same so you can only use the stated Q as a starting point. With LF stuff, you will probably not want to use anything tighter than 6. You want to choose your listening area for the mic sweep. A couple of feet deep, 4 - 6 ft wide and maybe +/- a foot in height around your nominal listening height. You then apply full range pink noise from the generator and set the RTA for 1/48 Out smoothing, 64k FFT, Forever Smoothing and I use Hann with 87.5% overlap. Now turn on the noise, start the RTA and smoothly and contiunously sweep the microphone throughout the listening zone. The HF response will settle right away, but it is still wise to continue this sweeping motion for a minute plus. Hit the Current button and your result will be moved to the main page. It is necessary to start and stop the RTA while the mic is in the listing zone so you will need to have a helper or use a laptop that you can take to the location. I sometimes do this measurement several times and then curve average the results. The results are remarkable repeatible. Small variations in results are just not significant.
I usually move the curve into the EQ section and use it to give me an idea for Freq, Q and Gain for the filters. Remember that a Flat final response is ALWAYS wrong. In-room curves always need some shaping. As a starting point I would use 120 Hz - 150 Hz as the hinge point for the bass lift. You are going to want 6 dB of lift (or more) in the bass range for things to sound proper. The amount of lift and how low in frequency you continue it are preference and Woofer related. My suggestion would be +6 dB (around 60 Hz) relative to your hinge point. The EQ engine provides all sort of target curve settings for the bass range. If you are fortunate enough to be using one of the many EQ options offered by REW, you will have no issues with predictions vs. results. I use the Generic EQ as my hardware is not included in the offerings and I have found it to be pretty close.
With a little practice this technique can become very powerful. Remember that you shouldn't boost much and that cutting high points is superior to attempting to fill a hole. It is sometimes better to lift the entire Subwoofer level and shave of the high points. I use PsychoAcoustic smoothing. It is basically 1/6 Oct but gives more weighting to peaks than holes, which has been proven subjectively many times over the years. My measurements much more closely agree with my subjective views using the PA smoothing and Moving Mic method.
I have read the REW manual, several threads, and watched youtube videos to no avail, I need help, please.
I run my test via my Apollo twin duo, iLoud Micro Monitor (Active) with an AKG C414 XLII. During the check level test, I am not able to have the input meter read -18 dbFS without getting feedback. I am using the standard settings as prescribed in other threads (see picture b). But, the highest I can have my input meter is around -27dBFS. Regardless of how I gain stage the mic pre or monitor signal, to match the meter to -18 dbFS, I get feedback.
Currently, my setup is the Left monitor, on the floor, in the right lower corner of the room, and the mic is on the right upper corner of the opposing side of the room (see picture A)
Perhaps my problem stems from having only one working input on my audio interface. Only input 2 works. Not sure if this is ok?
Consequently, I saw on a video that I had to connect a line output into input 2 in order to get a proper ref signal meter (see picture C). Since I only have one input, where my mic is, I'm afraid I cannot do this part. Is this a deal breaker?
This site uses cookies to help personalise content, tailor your experience and to keep you logged in if you register.
By continuing to use this site, you are consenting to our use of cookies.