HD MOVIE SOURCE
Member
- Joined
- Jun 23, 2021
- Posts
- 66
More
- Preamp, Processor or Receiver
- Denon x6500h
- Universal / Blu-ray / CD Player
- Panasonic UB9000
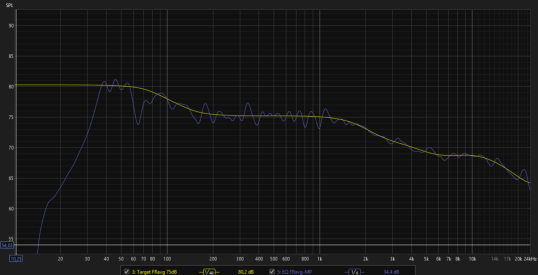
Thank you, very useful.


")