Measuring with a timing reference

FargateOne

Member
Joined
Jun 5, 2017
Messages
223
More  
Preamp, Processor or Receiver
Rotel RSX-1562
Additional Amp
Bryston 3B3 for fronts mains
Universal / Blu-ray / CD Player
Cambridge CXU
Front Speakers
B&W 804 D2
Center Channel Speaker
B&W HTM4D2
Surround Speakers
B&W 705
Subwoofers
SVS PC-2000 and SVS PC-2000 Pro
Other Speakers or Equipment
10 PEQ filters/channel in receiver with REW
Video Display Device
Samsung UN55ES8000
Other Equipment
miniDSP 2x4 HD
So...somebody?
 

sm52

Member
Thread Starter
Joined
Mar 14, 2019
Messages
863
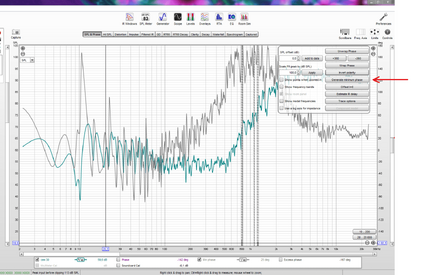
John, when I want to see the minimum phase on the graph after the measurement, I press 'generate'. The minimum phase graph appears. But it's on a much larger scale. To make the scale readable, you need to press 'generate' again. Can this process be done with one click?
 
Last edited:

John Mulcahy

REW Author
Joined
Apr 3, 2017
Messages
7,212
John, when I want to see the minimum phase on the graph after the measurement, I press 'generate'. The minimum phase graph appears. But it's on a much larger scale. To make the scale readable, you need to press 'generate' again. Can this process be done with one click?
Sorry, I don't know what you mean or which graph you are referring to.
 

sm52

Member
Thread Starter
Joined
Mar 14, 2019
Messages
863
Impulse Response.
 

Attachments

  • min phase2.PNG
    min phase2.PNG
    187.8 KB · Views: 30

John Mulcahy

REW Author
Joined
Apr 3, 2017
Messages
7,212
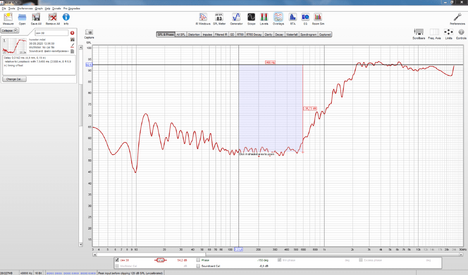
That image is the SPL & Phase graph, not the impulse response graph. Generating minimum phase doesn't affect the graph scales, if you want the phase to cover a different span on the graph use the zoom buttons to zoom out on the phase axis or use the graph limits button to set the phase range you want the graph to show.
 

sm52

Member
Thread Starter
Joined
Mar 14, 2019
Messages
863
Yes. I was wrong in the title of the graph. SPL & Phase. I said that when REW drew this graph, there is no minimum phase by default. To obtain a graph of the minimum phase, press the button shown with a red arrow. If you click on it once, the graph of the minimum phase is generated in an enlarged scale. To get it on a normal scale, you need to press the same button again. Those. you need to press this button twice. Why not generate and display at normal scale right away with one click?
 

John Mulcahy

REW Author
Joined
Apr 3, 2017
Messages
7,212
You must be doing something special. Pressing the button does not change the graph scales for me, however many times it is pressed. Nor should it. The graph scales are set by the controls I explained above.
 

sm52

Member
Thread Starter
Joined
Mar 14, 2019
Messages
863
Watch the video.
 

Attachments

  • bandicam_2020-09-30_18-27-02-760.mp4
    1.8 MB

John Mulcahy

REW Author
Joined
Apr 3, 2017
Messages
7,212
Shame you didn't start with that, or some screenshots. The issue was caused by not having any phase traces displayed, and hence no right hand phase axis displayed, before generating the minimum phase response. I have fixed it for the next beta.
 

sm52

Member
Thread Starter
Joined
Mar 14, 2019
Messages
863
John, I checked how the min phase is displayed after the update. Everything is as it should be. Thank you.
What is the difference between signal level and noise level for a measurement to be considered good? 40dB, 50dB, or more? For example, can such a tweeter graph be considered normal?
 

Attachments

  • tweeter.mdat
    2.4 MB · Views: 16

John Mulcahy

REW Author
Joined
Apr 3, 2017
Messages
7,212
The noise floor on that measurement is almost 74 dB down, which is very good. Above 40 dB is generally fine.
 

sm52

Member
Thread Starter
Joined
Mar 14, 2019
Messages
863
I don't see -74dB before the noise floor Even 40 dB is difficult to achieve.
 

Attachments

  • Noise floor.PNG
    Noise floor.PNG
    103.2 KB · Views: 23

sm52

Member
Thread Starter
Joined
Mar 14, 2019
Messages
863
Is the impulse response noise level not equal to the acoustic noise level in the room?
 

John Mulcahy

REW Author
Joined
Apr 3, 2017
Messages
7,212
No, not at all. Sweep measurement can see below the noise floor because of the nature of the sweep processing. The impulse response shows the signal-to-noise ratio achieved for the measurement.

36265
 

sm52

Member
Thread Starter
Joined
Mar 14, 2019
Messages
863
Or is the 74 dB difference between the noise level and the signal level obtained because the noise level is considered the noise level in the feedback loop, and the signal level is the acoustic level of the signal in the room?
 

sm52

Member
Thread Starter
Joined
Mar 14, 2019
Messages
863
Actually my question was about the noise level in the measurement room. In my measurement, this is only 39 dB below the signal level. Is this not a bad factor? Is it necessary to increase the signal level by at least 6-10 dB?
 

sm52

Member
Thread Starter
Joined
Mar 14, 2019
Messages
863
There is a Length parameter in the measurement window. I tried to take measurements on all variants. The charts are 98% the same. Distortion and waterfall graphs change. Maybe John knows what the pros and cons of increasing-decreasing this parameter are.
 

John Mulcahy

REW Author
Joined
Apr 3, 2017
Messages
7,212
From the help:

Each doubling of the sweep length improves S/N by almost 3 dB. However, the time required to perform the processing after each sweep will more than double. If REW is running on a computer which does not have a fast processor and a lot of memory, measurements will be much faster using the shortest sweep length (128k samples), at a small S/N penalty of about 3dB compared to the default. At least 4 GB of RAM and a fast processor are recommended if using the 1M sweep, at least 8 GB for the 4M sweep. Invalid measurements or out-of-memory errors may occur on computers which have insufficient RAM or processor speed.
 

sm52

Member
Thread Starter
Joined
Mar 14, 2019
Messages
863
In order for the computer to process the data without errors at Length = 4M, 8 GB of RAM and a fast processor are needed. Let's say this condition is met. But why are the frequency response graphs for Length from 128K to 4M the same? When I set this parameter to 4M, I expect a more detailed graph than when this parameter = 128K.
 

John Mulcahy

REW Author
Joined
Apr 3, 2017
Messages
7,212
What do you mean by more detailed? A longer sweep lowers the noise floor, it shouldn't change the measured response which should already be far above the noise floor.
 

sm52

Member
Thread Starter
Joined
Mar 14, 2019
Messages
863
A longer sweep lowers the noise floor,
is this the only thing that distinguishes Length = 256K from Length = 4M?

What do you mean by more detailed?
If we have as a result of measurement 5 values of the measured parameter, as a result of interpolation we will get not a smooth curve, but a broken line. And if we have 100 values, the graph will be more consistent with reality.
 
Top Bottom