Measuring with a timing reference

John Mulcahy

REW Author
Joined
Apr 3, 2017
Messages
7,212
Then I decided in the 'use loopback as timing reference' mode to disable the input to which the loopback signal arrives. REW was unhappy, but the measurement worked out. In the same place there is this surge, but of a lower level. How to explain this? If only one input channel is working, the second cannot influence it.
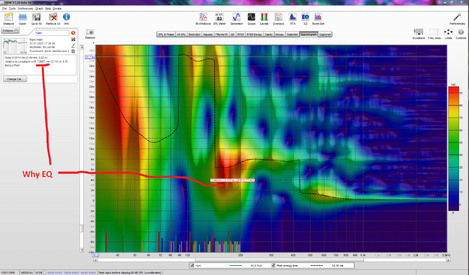
Disabling the loopback input doesn't remove the loopback signal, so it can still couple into the measurement input. If you will be using the minimum phase result anyway you can just measure without a timing reference.
 

sm52

Member
Thread Starter
Joined
Mar 14, 2019
Messages
863
I would like to understand how to get rid of this interference on the sound card inputs. But since the reason cannot be found yet, and this does not affect the final data, I will measure as is. John, in your opinion, if the graph of the minimum phase of all the loudspeakers together turned out parallel to the horizontal axis of the phase (if you smooth it very much), this should be the ideal option? Or is a gradual slope of the minimum phase graph from 20 Hz to 20 kHz the best option?
 

John Mulcahy

REW Author
Joined
Apr 3, 2017
Messages
7,212
The minimum phase response is constructed from the response magnitude, it will only be flat if the magnitude response is flat and has no roll-off at low or high frequencies, which is only the case for an ideal impulse, not for physical devices.
 

sm52

Member
Thread Starter
Joined
Mar 14, 2019
Messages
863
I was not talking about a perfectly flat minimal phase graph. Take a look at the screenshot. The thick red line is if the graph (4 dynamics) of the minimum phase is very smoothed. In the 30 Hz - 500 Hz section and in the 1 kHz - 5 kHz section, the smoothed minimum phase is flat. Is it better than the 500 - 1 kHz and 5 kHz - 20 kHz section?
1. The entire graph of the minimum phase from 20 Hz to 20 kHz, smoothed to the line, has a gradual falling slope.
2. The entire graph of the minimum phase from 20 Hz to 20 kHz, flattened to the line, is flat.
Which option is better for sound?
 

Attachments

  • Min phase.PNG
    Min phase.PNG
    58.3 KB · Views: 36

John Mulcahy

REW Author
Joined
Apr 3, 2017
Messages
7,212
To decide whether the drivers are well aligned it would be better to look at the peak energy trace on the wavelet spectrogram, an ideal response is a horizontal line. Here are typical settings to use:

33529


There is information about the wavelet spectrogram in Matt's introductory video at about 25:30,


There is also a discussion of wavelet analysis in this paper: http://www.audiomatica.com/wp/wp-content/uploads/audaesny2007.pdf and also in this one: http://www.dv2.fr/article/delay_alignment_a_survey.pdf

You can see some examples of wavelet measurements in these threads:

 
  • Like
Reactions: G29

sm52

Member
Thread Starter
Joined
Mar 14, 2019
Messages
863
When the drivers are aligned in time, does this align their phases?
 

sm52

Member
Thread Starter
Joined
Mar 14, 2019
Messages
863
I learned a bit about working with Wavelet Spectrogram. There is a difficulty in determining the distance equivalent to the time difference between the loudspeakers. I see, for example, 260 μs, but from a practical point of view, i need to see the equivalent in mm. Is there a checkbox that I have not marked to see that and that?
The second question is, what if the time difference is equivalent to 1.5m? How to remove it? I can move each lane separately - all the speakers are in separate boxes. But not 1.5 m.
 
Last edited:

John Mulcahy

REW Author
Joined
Apr 3, 2017
Messages
7,212
If you use Ctrl+shift and right-click & drag on the graph you will see times and distances for the selection. Or multiply the time by 343 m/s, 260 us corresponds to 89 mm. At the lowest frequencies there will be an upward curve as the driver rolls off, that is normal.
 

sm52

Member
Thread Starter
Joined
Mar 14, 2019
Messages
863
The second question is, what if the time difference is equivalent to 2.7m? How to remove it? I can move each lane separately - all the speakers are in separate boxes. But not 2.7 m. Or something I didn't understand.
 

Attachments

  • Delay.PNG
    Delay.PNG
    329.4 KB · Views: 61

John Mulcahy

REW Author
Joined
Apr 3, 2017
Messages
7,212
It is difficult to comment when you provide so little context. Is that a measurement with all drivers connected, so it has the whole speaker response? Have you taken any steps to minimise the room contribution so that the speaker's behaviour can be seen? The plot is so uneven it would appear to be showing more about the behaviour of the room than the speaker.
 

sm52

Member
Thread Starter
Joined
Mar 14, 2019
Messages
863
Yes, this is a measurement with all speakers connected. 4 speakers. Tweeter and midrange from 20 kHz go in one line. At 380 Hz, a midrange filter. 180 Hz upper midbass filter. At 110 Hz, a lower midbass filter. There is also a bass reflex designed for about 30 Hz. But my question is about the 2.7 meters, by which the upper midbass must be shifted in order to align with the midrange speaker. It is right? If the sub was 2.7 meters behind, that's fine. But a speaker playing 200-300 Hz is 2.7 meters behind a similar speaker playing 400-600 Hz. Something is wrong.
 

Attachments

  • Right.mdat
    2.4 MB · Views: 13

John Mulcahy

REW Author
Joined
Apr 3, 2017
Messages
7,212
How does it look if you invert the driver?
How are your crossovers implemented? Have you measured them?
 

sm52

Member
Thread Starter
Joined
Mar 14, 2019
Messages
863
Which loudspeaker to invert? All or one of the four?
 

Attachments

  • Crossover.PNG
    Crossover.PNG
    8.2 KB · Views: 38

John Mulcahy

REW Author
Joined
Apr 3, 2017
Messages
7,212
The one covering 200 - 300 Hz.

What do the responses of those crossover look like, individually and summed? Seems like they would have a lot of overlap.
 

sm52

Member
Thread Starter
Joined
Mar 14, 2019
Messages
863
I don't understand what needs to be done. REW, after measuring four speakers together, located in the one speaker box, showed that the upper midbass - Driver # 2 lags behind the mid-range speaker - Driver # 3 by 2.7 meters.It can not be so. There is a mistake somewhere. Here are measurements of these drivers without crossovers, but in their places in the speaker cabinet.
 

Attachments

  • midrange.mdat
    2.4 MB · Views: 11
  • upper midbass.mdat
    2.4 MB · Views: 10

John Mulcahy

REW Author
Joined
Apr 3, 2017
Messages
7,212
It would probably be worth making nearfield measurements of each driver, each at the same distance from the cabinet and on the driver's axis, with the crossovers active, to see how their responses look. The individual responses could then be summed to see how they look combined.

The spectrogram is showing where peak energy occurs. The misalignment can be related to differences in distance to the acoustic centres of the drivers, phase shifts in the crossovers and room effects.
 

sm52

Member
Thread Starter
Joined
Mar 14, 2019
Messages
863
Is that it should be?
 

Attachments

  • wavelet right.PNG
    wavelet right.PNG
    335.8 KB · Views: 51
Joined
Feb 8, 2018
Messages
279
Location
Italy
To carry out an alignment of a cross-over filter only through the acoustic frequency response is possible but it is quite difficult, it should be integrated with an impedance measurement and above all with the electrical response measurement across the loudspeaker.
I always measure the response of each individual speaker without a filter when they are already mounted in a loudspeaker, then I identify the optimal cut-off frequencies based on the characteristics of the speakers and also on their response in the room. Then, with the aid of a simulation software, I check the components necessary to make the filter cells and the simulated response of all the ways. I carry out the cross-over and this time I trace the electrical response curves of the crossover to check the cutoff frequencies and also the impedance curve, then I carry out the acoustic response measurement to understand if the simulated project is confirmed.
Normally, the measurement of the real frequency response always differs from the simulated one, therefore it is necessary to make adjustments by tracing and changing the values of the components.
The filter that I have seen in the figure has some values of the components that leave me perplexed, especially the inductances in series with the speakers have an excessive resistive value and cause a strong attenuation.
 

sm52

Member
Thread Starter
Joined
Mar 14, 2019
Messages
863
Antonio,
I consider the method of building the sound of acoustics described by you to be correct. I do the same. The only question is why the response of the modeled crossover is slightly different from the actual response. I am modeling in VituixCad. And you?
Why the inductors connected in series with the speaker have such high resistances - this is how I told the simulation program the values of the intrinsic parameters of the speakers. The main two - are the DC resistance and the inductance of the internal inductor of the loudspeaker itself. I haven't done that before. But over time, I considered it correct, and since then I have been doing this.
 
Joined
Feb 8, 2018
Messages
279
Location
Italy
I don't know the VituixCad program, but looking at the wiring diagram of your filter there are several things that don't convince me.
The RE of the nominal 8 ohm speaker measured in continuous is normally around 6 ohm but I believe that this value should be inserted within the Thiele-Small parameters of the driver and not as a resistance in series to the coil. Having said that, I know that for example you have not inserted any speaker impedance compensation network which I normally do. To be more precise I always insert at least on the bass speaker a compensation network consisting of an R + C parallel to the speaker in order to compensate the inductive effect of the coil. This will come in handy when you fine tune the cross-over cutoff frequency. I also note that despite the rather low cutoff frequency between the bass route with the mid-bass you have decided to use a very bland 6db / oct filtering. I would have opted for a 12db / oct cut also to slightly reduce the inductance value and decrease the resistance value of 2.2 ohm which seems really excessive to me.
Consider that between the simulated and the real there is not always an exact correspondence due to the mathematical model used by the software to simulate the behavior of the speaker, normally the help of the software covers 60-70% of the result.
I use a slightly outdated Audio for windows software from the Italian electroacoustic magazine Audioreview Afw currently updated with two software Loudspeakers systems ’Design Software LDS and Acoustic Load AUDIO Bass ALAB
Greetings from Italy
 
Joined
Feb 8, 2018
Messages
279
Location
Italy
The Afw software has a very sophisticated simulation which takes into account in addition to the parameters of the speakers also the acoustic load of the speaker and the positioning of the speakers on the front panel and also other features such as the distance to the floor and the output resistance of the amplifier and the phase in which the speakers are connected to the crossover, with this program I can get very close to the real functioning of the system.
On the other hand, it is quite difficult for those with little experience and need to simulate every aspect of the system well in order to obtain a result very close to reality.
Greetings and good simulation
 
Joined
Feb 8, 2018
Messages
279
Location
Italy
I found where you need to set the resistance of the speaker coil is in the Driver Library - Edit parameters section of VirtualxCad.
Regards
 

FargateOne

Member
Joined
Jun 5, 2017
Messages
223
More  
Preamp, Processor or Receiver
Rotel RSX-1562
Additional Amp
Bryston 3B3 for fronts mains
Universal / Blu-ray / CD Player
Cambridge CXU
Front Speakers
B&W 804 D2
Center Channel Speaker
B&W HTM4D2
Surround Speakers
B&W 705
Subwoofers
SVS PC-2000 and SVS PC-2000 Pro
Other Speakers or Equipment
10 PEQ filters/channel in receiver with REW
Video Display Device
Samsung UN55ES8000
Other Equipment
miniDSP 2x4 HD
HI,
@John Mulcahy , I read the documents you referred to in post #30 and watched the video. I don't pretend to understand all in detail but I would like to know if I am capable to get a better understanding the timing of the sub and the speakers. See my mdat file. I measured speakers + sub (one sub only, 5.1 system) with PEQ filters manually set in the receiver. XO is at 80 Hz.
I believe that it seems correct. BTW what happens around at 232 Hz (Center+sub) or worst at 112 Hz at 197 Hz with the rear left surround?
 

Attachments

  • center wavelet.jpg
    center wavelet.jpg
    151.3 KB · Views: 46
  • wavelet study.mdat
    11.2 MB · Views: 22
Top Bottom