Calculation of the minimum phase.

sm52

Member
Thread Starter
Joined
Mar 14, 2019
Messages
863
John Mulcahy
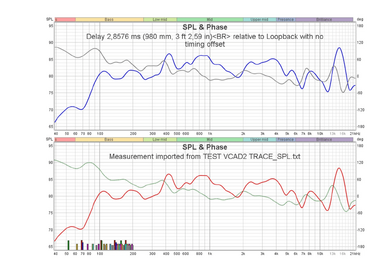
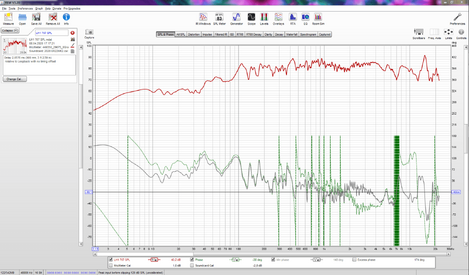
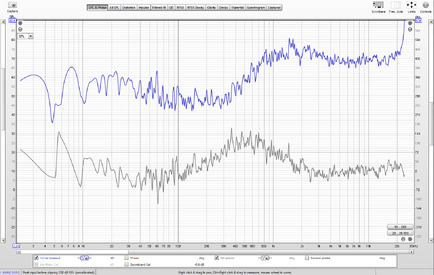
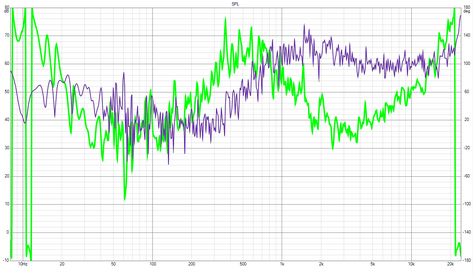
I have measured the impulse response of the tweeter in REW. Then I exported this measurement to a text file for the crossover simulation program. VituixCad2. In this program, I drew only a signal source, a wire and one HF speaker. I have generated the minimum phase in REW and in VituixCad2. Which minimum phase graph is more corresponds to reality? I am attaching a measurement file, a .txt file and screenshots of the minimum phase in two programs. In the screenshot of VituixCad2, the minimum phase is green.
 

Attachments

  • titan.mdat
    2.4 MB · Views: 11
  • titan.txt
    2 MB · Views: 8
  • titan REW.PNG
    titan REW.PNG
    70 KB · Views: 35
  • titan VC2.PNG
    titan VC2.PNG
    63.6 KB · Views: 38

EarlK

Member
Joined
May 22, 2017
Messages
221
Here's my present thinking on the matter ( open to change with newer///better information )

You might want to first practice exporting ( and then importing ) your file out of REW and then back into REW .

Then compare the phase of the two files as seen within the Overlays window ( in the phase tab ).

Doing so might trigger other ( newer ) more basic questions about phase accuracy ( after an Export then Import routine ).

Short answer, I'd believe the MP ( Minimum Phase ) plot from REW more so since its generated from the original file ( as opposed to one that has gone through an export/import routine ).

:)

PS1: I'm not sure why you are pursuing MP questions ( here ) when you've decided to use VituixCad2.
- It's author is very adamant about the need to use actual X,Y, Z ( spatial ) measurements for all drivers as mounted within an enclosure. He's very anti Minimum Phase.

PS2: XSim is a more amicable program to use if one wants to use the more simplistic Minimum Phase approach ( with a Z offset ) for quick prototyping of passive networks.

PS3: Be aware that MP is an approximation that can change ( shift phase position ) quite a bit ( all depending on the frequencies and slope change ) chosen to append the High and Low tails onto ( before the HB Transform is applied ) .

PS4: MP is far from an absolute set of values > I see it more like a handful of good guesses ( IMHO ) when everything goes well .

PS5: MP realities should be checked by looking at simple to execute response changes ( such as cancellation at crossover when one drivers polarity is flipped ).
- A good MP prediction should result in a solid ( measurable + repeatable ) response change under those conditions.
- Therefore, when using MP one should adopt the adage "Trust, but Verify" .
 
Last edited:

sm52

Member
Thread Starter
Joined
Mar 14, 2019
Messages
863
EarlK
I talked to Kimmo and realized that his position on the minimum phase is tough. But then why use it as an opportunity? He would simply rule out so neither could not try to look at her.
It seems to me that too many people observe how the minimum phase behaves when changing the crossover elements, so the display of the minimum phase remains in its program.
 

EarlK

Member
Joined
May 22, 2017
Messages
221
I use Minimum Phase when proto-typing theoretical networks within XSim.

Since I bi-amp my own speakers I'm typically just designing a HiPass ( with HF contouring for my horn/diver combo ).

If you're committed to using VituixCad2 for a full design then you should also commit to following the authors directions and guidelines

:)

FWIW ( to this discussion );
- Hopefully you realize that the act of tracing a manufacturer's published response ( for any given transducer ) by definition gives back a MP trace ( due to there being no real excess phase added to the process of "tracing" ). This is especially true if you use the trace tool found in VituixCad2.
 

Bernard

Member
Joined
May 22, 2017
Messages
120
:)
For What It's Worth ( to this discussion );
- Hopefully you realize that the act of tracing a manufacturer's published response ( for any given transducer ) by definition gives back a MP trace ( due to there being no real excess phase added to the process of "tracing" ). This is especially true if you use the trace tool found in VituixCad2.

Hello Earl,
It's worth it!
I drew the spl curve with the tools of the vituixcad factory from a curve of my own factory.
Here's what it looks like.
The upper curve is the original REW curve and, of course, the lower one is the VCad curve.
I had noticed that VCad2 was creating phase values without knowing why.
These stories of minimal phase create endless bickering on some French fora.
I was told that measurements had to be made at 88.2 or 96 kHz for REW to calculate the minimum phase properly.
Mine was done at 44.1 kHz last year.
@+
 

Attachments

  • Min Phase REW v VCAD2.png
    Min Phase REW v VCAD2.png
    253 KB · Views: 34

sm52

Member
Thread Starter
Joined
Mar 14, 2019
Messages
863
Bernard,
it seems to me that to test the assumptions, you need to use a real measurement, and not a programmatically created graph. The program generated graph is mathematically perfect, which is not the case in the real world. A discrepancy between REW and VCad2 occurs at HF.
 

Bernard

Member
Joined
May 22, 2017
Messages
120
SM52,
Excuse me Sir for forgetting to attach the mdat file that was used to produce these two snapshots.
FWIW.
 

Attachments

  • LH1 707 SPL.mdat
    1.9 MB · Views: 9

sm52

Member
Thread Starter
Joined
Mar 14, 2019
Messages
863
@Bernard,
what is your opinion, which program displays the phase and the minimum phase more correctly?
The second question is, how did you get such a beautiful measurement? I am now about the graph of the measured phase. Usually it looks like a continuous forest of transitions from -180 degrees to +180 degrees, and only at high frequencies it looks like a line. With such a measurement, you can refuse to use the minimum phase, but use the measured phase.
 

Attachments

  • LH1 707.PNG
    LH1 707.PNG
    154.8 KB · Views: 17
Last edited:

Bernard

Member
Joined
May 22, 2017
Messages
120
sm52,

I didn't try to find out which software is the best.
Starting from EarlK's remark, my goal was to compare the minimum phase curve generated by REW and the phase generated by the VCAD2 tool from an SPL curve drawing.

We launch REW, open the file, click on the All SPL tab, apply a smoothing, and take a snapshot with the Capture button.
Next, we launch VCad2, choose Tools Trace SPL and open the snapshot we just made with REW. There is a video on Youtube: VituixCAD SPL Trace (1.1.18.1 or later) - YouTube .
We go back to REW and import the text file created by VCad2.
You need to take a snapshot of the minimum phase of the REW mdat file and another snapshot of the phase of the VCad2 txt file in order to be able to compare the two phase curves.
You can see that the curves are very close and that the Trace SPL tool of VCad2 gives good results if the work is done carefully.
The differences must come from the calculation method used by each of the two creators.

The goal is achieved: EarlK's remark is verified. QED.
 

sm52

Member
Thread Starter
Joined
Mar 14, 2019
Messages
863
@Bernard,
On a Youtube video, the image is converted into a text file. This is not what is required. In post # 1, I formulated a question on the strong discrepancy between the display of the minimum phase (as well as the measured phase, but here I did not post pictures) in two programs. This is based on REW's actual measurement of a real tweeter.
 

jtalden

Senior Member
Joined
May 22, 2017
Messages
887
Location
Arizona, USA
More  
Preamp, Processor or Receiver
Marantz AV7705 Pre/Pro
Main Amp
VTV 6 chnl NC252MP P-amp x 2
Additional Amp
Behringer DCX2496 x 2
Universal / Blu-ray / CD Player
OPPO BDP-103 Universal Player
Front Speakers
DIY SEAS H1456/H1212 Spkr x 5
Subwoofers
DIY JBL 2235H 15" SW x 2
Video Display Device
JVC DLA-X790R
Screen
Da-Lite Da-Snap 39105V - 92"
They look the same to me if the same settings are applied.
Top chart is VituixCAD with a 7mm Z offset (distance) and the bottom chart is REW at 1/24 octave smoothing.
39050
 

sm52

Member
Thread Starter
Joined
Mar 14, 2019
Messages
863
jtalden,
Cool. You were the first to clarify something in this matter. But there is really no 7mm offset. Why is needed to do it? Where did 7 mm come from?
 

jtalden

Senior Member
Joined
May 22, 2017
Messages
887
Location
Arizona, USA
More  
Preamp, Processor or Receiver
Marantz AV7705 Pre/Pro
Main Amp
VTV 6 chnl NC252MP P-amp x 2
Additional Amp
Behringer DCX2496 x 2
Universal / Blu-ray / CD Player
OPPO BDP-103 Universal Player
Front Speakers
DIY SEAS H1456/H1212 Spkr x 5
Subwoofers
DIY JBL 2235H 15" SW x 2
Video Display Device
JVC DLA-X790R
Screen
Da-Lite Da-Snap 39105V - 92"
I have never used any passive XO design software and haven't studied their procedures so take these general thoughts appropriately:

Your measurements look very choppy probably due to excessive room effects. Carefully follow VitiuxCAD measurement instructions. I have seen comments from others that they are very detailed. The speaker and mic should be placed away from room surfaces. Measurements of the 2 drivers must be at the same fixed mic position (maybe 0.5 - 1 m distant depending on speaker size and XO point) and typically this is done on the TW axis. This will match the Z offset for the 2 drivers so that the relative phase between them will be correctly represented. The apparent roll up of the HF phase is only a result of not properly adjusting the Z offset to remove the mic distance and any other measurement system delays.
 

sm52

Member
Thread Starter
Joined
Mar 14, 2019
Messages
863
I set Z = 7mm, smoothing 1/24. This changes the graph of the measured phase in the GD & Phase window and in the SPL window, but does not change the graph of the minimum phase in the SPL window. Those, the measured phase graph moves, but the minimum phase graph remains the same.
 

jtalden

Senior Member
Joined
May 22, 2017
Messages
887
Location
Arizona, USA
More  
Preamp, Processor or Receiver
Marantz AV7705 Pre/Pro
Main Amp
VTV 6 chnl NC252MP P-amp x 2
Additional Amp
Behringer DCX2496 x 2
Universal / Blu-ray / CD Player
OPPO BDP-103 Universal Player
Front Speakers
DIY SEAS H1456/H1212 Spkr x 5
Subwoofers
DIY JBL 2235H 15" SW x 2
Video Display Device
JVC DLA-X790R
Screen
Da-Lite Da-Snap 39105V - 92"
Okay, I see that now. Sorry for the misdirect.
 

jtalden

Senior Member
Joined
May 22, 2017
Messages
887
Location
Arizona, USA
More  
Preamp, Processor or Receiver
Marantz AV7705 Pre/Pro
Main Amp
VTV 6 chnl NC252MP P-amp x 2
Additional Amp
Behringer DCX2496 x 2
Universal / Blu-ray / CD Player
OPPO BDP-103 Universal Player
Front Speakers
DIY SEAS H1456/H1212 Spkr x 5
Subwoofers
DIY JBL 2235H 15" SW x 2
Video Display Device
JVC DLA-X790R
Screen
Da-Lite Da-Snap 39105V - 92"
A quick look at your REW impulse indicates it appears to be negative polarity so I inverted the polarity in REW and then reexported the .txt file again. After reloading it into VituixCAD now the minimum phase results are the same. Inversion in VituixCAD does not work the same, but I think that is because it is a .txt being loaded and not the original impulse file.
 

sm52

Member
Thread Starter
Joined
Mar 14, 2019
Messages
863
jtalden
IR polarity at post # 1 is positive. Because with it, the Step Response is positive.
There is other news. If in VituixCad2, on the drivers tab at the bottom, mark 'Minimum phase', then in the SPL window a minimum phase appears, which moves if you change Z. But I'm not sure what happens if each driver is loaded in the same way. Should each driver be aligned the same 7mm as the tweeter, or should each be aligned separately.
 

jtalden

Senior Member
Joined
May 22, 2017
Messages
887
Location
Arizona, USA
More  
Preamp, Processor or Receiver
Marantz AV7705 Pre/Pro
Main Amp
VTV 6 chnl NC252MP P-amp x 2
Additional Amp
Behringer DCX2496 x 2
Universal / Blu-ray / CD Player
OPPO BDP-103 Universal Player
Front Speakers
DIY SEAS H1456/H1212 Spkr x 5
Subwoofers
DIY JBL 2235H 15" SW x 2
Video Display Device
JVC DLA-X790R
Screen
Da-Lite Da-Snap 39105V - 92"
I would expect the Z offset must be set the same for both drivers if the mic was located at the same distance. We are accounting for the distance to the mic for the sound arrival. If the mic is placed a different distances for the 2 drivers then different Z offsets are needed.
Again, just my expectation. I would refer you to the instructions.
 

Pawel Liedtka

Registered
Joined
Feb 25, 2021
Messages
1
More  
Preamp, Processor or Receiver
Denon AVR 3802
Front Speakers
DIY SB/Seas
With the loudspeaker CAD phase and XYZ, especially Z can make or break the X-O. Normally one would use min phase from FRD measurements, but it doesn't mean the calculated phase would 100% OK, since most measurements have limited bandwidth. XSim for example has additional setting where a slope in freq resp can be selected to 'fix' or manipulate freq resp and min phase.
To get the offset between drivers, take a FRD measurement with both drivers In Phase then Out Off Phase and import them into CAD as additional drivers. Then use FRD of each driver and set the XYZ or offset/(slopes in XSim) so the summed simulation is same as the In Phase and Out Off Phase measurements.
I hope this helps a bit.
 
Last edited:
Top Bottom