


Hi,
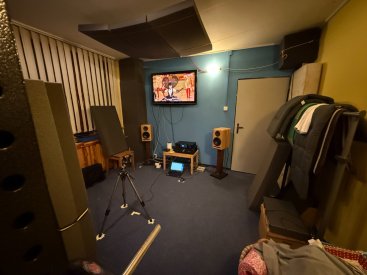
I moved my listening room to basement and spent some time to find the right place for speakers and listening position, using REW measurements.
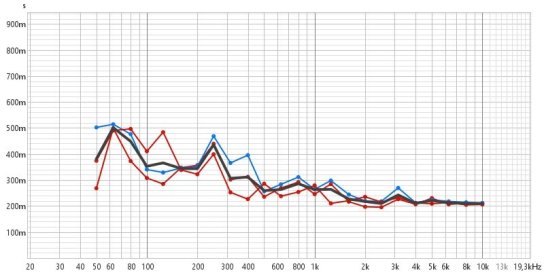
Now I think about some acoustic treatment of the room and I tried to use some available material (e.g. old matrices) to improve RT60 in front corners.
I measured before and after, and there is quite nice RT60 improvement.
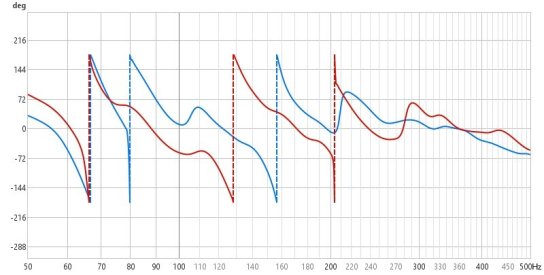
Nevertheless, I am not able to interpret some results
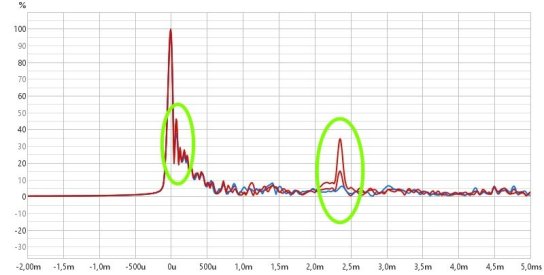
1. There are some ETC peaks at 2, 5 ,9,7 ms. Is it possible to guess the causes?
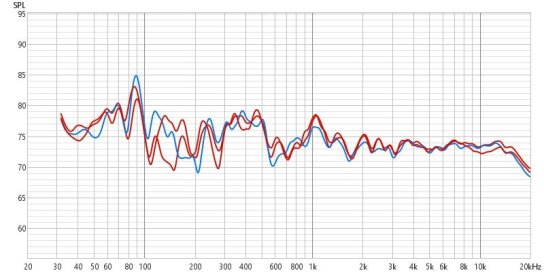
2. SPL for 80-100Hz is nicely compensating in L+R measurement compared to individual channels, while for 10k Hz it is the opposite, L+R create dip. Any reasons?
3. Any suggestions for acoustic treatment?
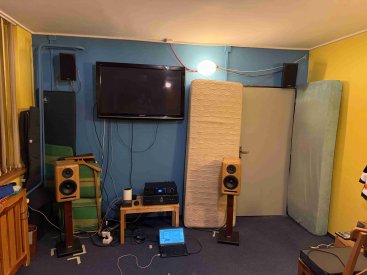
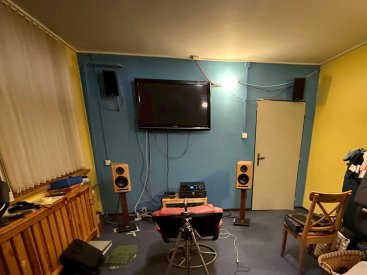
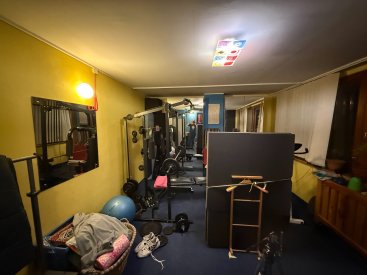
I plan bass trap to front left corner and panel to front right corner with doors. Something on front wall and front ceiling. Probably curtain over windows. Not sure what to do with rear wall.
My room is 5x3,7x2,5 meters, most of left side are windows.
Speakers are 60 cm from left wall, 90 cm from front wall, 180 cm aside. Listening position is 230cm from front wall and 150 cm from left wall.
Any help is highly appreciated, as I am not able to find out more, even with AI help :-(
Measurement and photos are enclosed.
Many thanks
Marian
I moved my listening room to basement and spent some time to find the right place for speakers and listening position, using REW measurements.
Now I think about some acoustic treatment of the room and I tried to use some available material (e.g. old matrices) to improve RT60 in front corners.
I measured before and after, and there is quite nice RT60 improvement.
Nevertheless, I am not able to interpret some results
1. There are some ETC peaks at 2, 5 ,9,7 ms. Is it possible to guess the causes?
2. SPL for 80-100Hz is nicely compensating in L+R measurement compared to individual channels, while for 10k Hz it is the opposite, L+R create dip. Any reasons?
3. Any suggestions for acoustic treatment?
I plan bass trap to front left corner and panel to front right corner with doors. Something on front wall and front ceiling. Probably curtain over windows. Not sure what to do with rear wall.
My room is 5x3,7x2,5 meters, most of left side are windows.
Speakers are 60 cm from left wall, 90 cm from front wall, 180 cm aside. Listening position is 230cm from front wall and 150 cm from left wall.
Any help is highly appreciated, as I am not able to find out more, even with AI help :-(
Measurement and photos are enclosed.
Many thanks
Marian


") .
.


