


-
AUDIO VIDEO PROCESSING, SETUP & ENVIRONMENTOfficial REW (Room EQ Wizard) Support Forum Audiolense User Forum Calibration Equipment Auto-EQ Platforms / Immersive Audio Codecs Video Display Technologies / Calibration AV System Setup and Support Listening Room / Home Theater Build Projects Room Acoustics and Treatments AV Showcase Movies / Music / TV / Streaming
-
AUDIO VIDEO DISCUSSION / EQUIPMENTHome Theater / Audio and Video - Misc Topics Essence For Hi Res Audio AV Equipment Advice and Pricing Awesome Deals and Budget AV Equipment AV Receivers / Processors / Amps UHD / Blu-ray / CD Players / Streaming Devices Two Channel Hi-Fi Equipment DIY Audio Projects Computer Systems - HTPC / Gaming HD and UHD Flat Screen Displays Projectors and Projection Screens AV Accessories Buy - Sell - Trade
Navigation
Install the app
How to install the app on iOS
Follow along with the video below to see how to install our site as a web app on your home screen.
Note: This feature may not be available in some browsers.
More options
You are using an out of date browser. It may not display this or other websites correctly.
You should upgrade or use an alternative browser.
You should upgrade or use an alternative browser.
V5.20.14 early access build
- Thread starter John Mulcahy
- Start date

- Status
- Not open for further replies.
John Mulcahy
REW Author
Thread Starter
- Joined
- Apr 3, 2017
- Posts
- 9,457
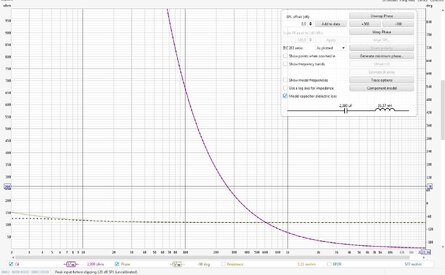
Impedance measurements and model fits are behaving normally for me.
I took measurements of inductors and capacitors a couple of weeks ago. Then REW showed zero ESR for some capacitors. I was very surprised. And on the latest update, these same measurements no longer show zero ESR. There are very small, but not zero. The measurement was taken on 05/16/2023.
Last edited:
John Mulcahy
REW Author
Thread Starter
- Joined
- Apr 3, 2017
- Posts
- 9,457
No changes to the modelling code since Feb 2022.
John Mulcahy
REW Author
Thread Starter
- Joined
- Apr 3, 2017
- Posts
- 9,457
The peak of that measurement (i.e. the point of maximum amplitude) is at 29 us. You'd probably get a more accurate t=0 estimate by using a higher sample rate.
This is the measurement of the tweeter. Does it have negative polarity? It has positive polarity. Looking at the phase plot, after using 'estimate IR delay', REW correctly set t=0. The first top peak is the 'correct' peak. If you set t=0 to the second, negative peak, the amplitude of which is greater, then the phase graph is scattered at the end by +180 and -180, which is wrong. Based on this, t=0 is set a little after the peak.
But I'm fine with that, I didn't write it to be fixed as a bug. Only as information that it happens.
Where can I download the version that was the newest 16.05?
But I'm fine with that, I didn't write it to be fixed as a bug. Only as information that it happens.
Where can I download the version that was the newest 16.05?
John Mulcahy
REW Author
Thread Starter
- Joined
- Apr 3, 2017
- Posts
- 9,457
Older versions are in the installers folder of roomeqwizard.com, but currently the earliest there is ea60 from 20th May.
I'm not sure what you are trying to say about peaks and moving t=0 around, my comment had nothing to do with that. To be clear on terminology, the peak of the IR is the largest absolute value, wherever it occurs. t=0 on the response you posted was probably about 2 us later than it should be, but that is only a tenth of a sample interval. It would probably be better located by using a higher sample rate. It does not occur after the peak of the IR.
I'm not sure what you are trying to say about peaks and moving t=0 around, my comment had nothing to do with that. To be clear on terminology, the peak of the IR is the largest absolute value, wherever it occurs. t=0 on the response you posted was probably about 2 us later than it should be, but that is only a tenth of a sample interval. It would probably be better located by using a higher sample rate. It does not occur after the peak of the IR.
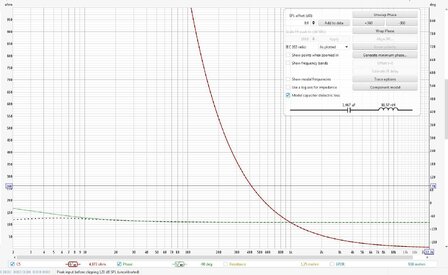
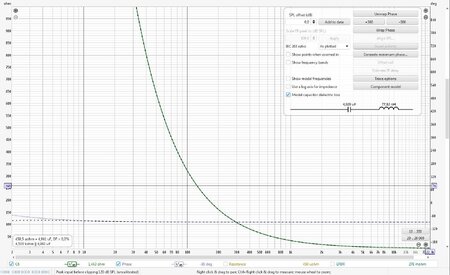
I checked the capacitor impedance measurement file on version 60 and saw measurements where ESR=0. And then I launched version 64, it has the same thing. The first time I didn't get to the measurements where it shows, so I thought there were differences. I'm sorry for the inconvenience.
Attachments
Good! In the latest version, both SPL and Decay are highlighted, which is annoying because it forces you to hover over the list window every time. An option to turn it off would be great!OK, I'll add a View preference.
John Mulcahy
REW Author
Thread Starter
- Joined
- Apr 3, 2017
- Posts
- 9,457
I don't know what you mean by that. The View preference will control whether the trace name is shown when the trace is highlighted.In the latest version, both SPL and Decay are highlighted
Didn't you mean you'd add an option to turn off Selected Highlight??I don't know what you mean by that. The View preference will control whether the trace name is shown when the trace is highlighted.
John Mulcahy
REW Author
Thread Starter
- Joined
- Apr 3, 2017
- Posts
- 9,457
Would you please consider an option to disable displaying of graph names when highlighted?
OK, I'll add a View preference.
davide.bortolami-sb
Registered
- Joined
- Apr 20, 2021
- Posts
- 14
Is there any way I can move the distortion info around in the RTA?
Oh...

I thought there would be a feature to turn off this highlighting...
It worked fine when I opened a saved messurement to check it, but when I made a new measurement or created multiple averages, the highlighting was fixed, which was inconvenient.
I thought there would be a feature to turn off this highlighting...
It worked fine when I opened a saved messurement to check it, but when I made a new measurement or created multiple averages, the highlighting was fixed, which was inconvenient.
KlangBoost
Registered
- Joined
- Jun 10, 2023
- Posts
- 2
Hello REW community,
I have the problem with the newer versions (x64 5_20_14ea56+64) that I cannot open older measurements.
If I install a version (x64 5_20_14ea29) that I used before, I can open the older measurements but not those created with the newer version.
Pops up:
File is not in a Room Eq compatible .mdat Format
java.io.InvalidClassException
I have not been able to read about this error here.
Greetings
John Mulcahy
REW Author
Thread Starter
- Joined
- Apr 3, 2017
- Posts
- 9,457
That will be due to this, from 6th February:I have the problem with the newer versions (x64 5_20_14ea56+64) that I cannot open older measurements.
If I install a version (x64 5_20_14ea29) that I used before, I can open the older measurements but not those created with the newer version.
- Fixed: The configurable equaliser class definition had an error that meant it became incompatible with earlier builds in ea29, preventing mdat files saved by ea28 and earlier that used a configurable equaliser from loading. The definition has been corrected to be compatible with the ea28 and earlier builds but that makes it incompatible with the ea29 and ea30 builds. A workaround for those is to load the file in ea30, change to another equaliser then save it again.
John Mulcahy
REW Author
Thread Starter
- Joined
- Apr 3, 2017
- Posts
- 9,457
I have added a preference for that in the next build. I don't understand how you could have a fixed highlight on the decay graph though, what steps did you go through to get that?I thought there would be a feature to turn off this highlighting.
John Mulcahy
REW Author
Thread Starter
- Joined
- Apr 3, 2017
- Posts
- 9,457
Never mind, I have found the cause of that and fixed it.I have added a preference for that in the next build. I don't understand how you could have a fixed highlight on the decay graph though, what steps did you go through to get that?
John Mulcahy
REW Author
Thread Starter
- Joined
- Apr 3, 2017
- Posts
- 9,457
Builds updated today with these changes:
- Added: In the SPL & Phase graph controls there is an option to draw a line at phase zero, since that may not correspond to a grid line
- Added: Files can be dragged onto the Overlay window with the same behaviour as dragging them onto the main window
- Added: There is a view preference to control whether to show the names of highlighted traces
- Added: There is a view preference to control whether to highlight the selected trace on overlay graphs
- Added: The RT60 decay colour scheme settings have an option to control whether the top of the SPL axis is adjusted to suit the result
- Changed: The data offset of a dB or RMS average is the average of the data offsets of the measurements averaged. That has no effect on SPL values, but gives more comparable dBFS values.
- Changed: The auto/manual RT60 decay calculation settings choice is remembered for the next startup
- Changed: Disabled filters are sorted to the end
- Changed: The lower frequency limit of Wavelet spectrograms depends on the IR windows width rather than the spectrogram time span
- Fixed: Highlighting was not cleared when changing between graphs
KlangBoost
Registered
- Joined
- Jun 10, 2023
- Posts
- 2
Thank you.That will be due to this, from 6th February:
Open the measurements in ea29 and change the equaliser to generic then save them again, they should then open in current versions and you can switch them back to a configurable equaliser.
- Fixed: The configurable equaliser class definition had an error that meant it became incompatible with earlier builds in ea29, preventing mdat files saved by ea28 and earlier that used a configurable equaliser from loading. The definition has been corrected to be compatible with the ea28 and earlier builds but that makes it incompatible with the ea29 and ea30 builds. A workaround for those is to load the file in ea30, change to another equaliser then save it again.
Had looked through the thread before registering and probably overlooked it.
But I don't speak English that well either, so I'll use a translator
")
Do I have to do this for each individual measurement in an mdat?
Another observation just came up:
If I change the smoothing in the overlay tab Phase, the phase changes enormously, not only in the ripple as one would assume.
John Mulcahy
REW Author
Thread Starter
- Joined
- Apr 3, 2017
- Posts
- 9,457
Afraid so, equaliser setting is separate for each measurement, but you don't have to save them individually.Do I have to do this for each individual measurement in an mdat?
The trend should remain the same but the excess phase rotations due to response nulls will gradually be removed as smoothing increases. If there is a particular measurement you are concerned about best attaching the mdat.If I change the smoothing in the overlay tab Phase, the phase changes enormously, not only in the ripple as one would assume.
John Mulcahy
REW Author
Thread Starter
- Joined
- Apr 3, 2017
- Posts
- 9,457
What action led up to the error?Error value report.
I dreamed about this all my life.Added: In the SPL & Phase graph controls there is an option to draw a line at phase zero, since that may not correspond to a grid line

As I understand it, this line will always be this color. I think she stands out too much. It would be better to make her paler. It can be the same color, but more pale. And. Is it possible to add the same for impuls graphs, and the same in the Overlays window? For phase and impuls.
- Status
- Not open for further replies.


Popular tags
20th century fox
4k blu-ray
4k uhd
4k ultrahd
action
adventure
animated
animation
bass
blu-ray
calibration
comedy
comics
denon
dirac
dirac live
disney
dolby atmos
drama
fantasy
hdmi 2.1
home theater
horror
kaleidescape
klipsch
lionsgate
marantz
movies
onkyo
paramount
pioneer
rew
romance
sci-fi
scream factory
shout factory
sony
stormaudio
subwoofer
svs
terror
thriller
uhd
ultrahd
ultrahd 4k
universal
value electronics
warner
warner brothers
well go usa