Matthew J Poes
AV Addict
Thread Starter
- Joined
- Oct 18, 2017
- Posts
- 1,904
After learning that this new approach exists and after a suggestion of how to accomplish this from @John Mulcahy, I believe that I have accurately tested this approach and come up with basically accurate results. It is not perfect, and I learned a lot in this experiment, but the biggest thing I learned is that this is a MUCH better method for the more average DIYer like us to use in testing TL. The advantage in improved S/N is significant.
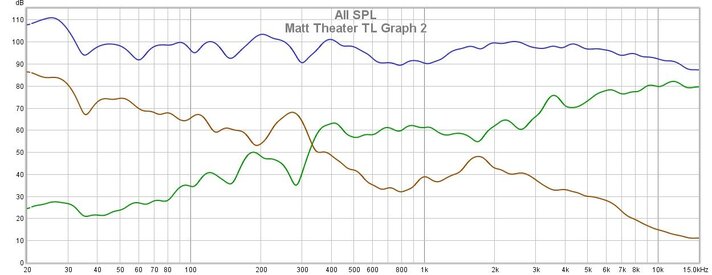
Here is the Raw Data

The Purple is the measurements inside the theater room, Brown is the response in the room immediately adjacent to the theater. The measurements were taken roughly 6-7 feet apart. Inside the theater, about 3 feet from the wall, and outside the theater about the same distance. The green line is the transmission loss. Because this was done with a Sine Sweep measurement, I have IR's and the Green is actually the transfer function of the wall.
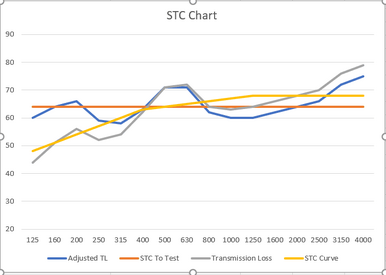
This can then be entered into a spreadsheet in accordance with ASTM E413 to calculate STC. I haven't actually done this manually before, so when I made this up, I did it according to that document, but am not 100% certain it is right. None the less, I believe this is right, and here are the results of that.

The flat orange line represents the STC curve I wanted to test. The others represent either the actual TL or the corrected curves of each for comparison. The wall should have been an STC of 73, but it is not shocking that I fell short of that. There are always some issues that cost you a few STC points here and there. You can see that my main losses are due to some dips between 100hz and 500hz and again above 1khz up to 2khz.
Now compared to the old method, this method doesn't allow a traditional means of spatial averaging. You can't just move a mic around while a tone plays and the RTA records (which removes the effects of resonances and smooths the response quite a bit). This smoothing is really needed for calculating STC, so to do that you have to keep rerunning the sweeps in different locations. It didn't work so well for me, so I need to play with that when I have time. I got a few odd results and averaging them gave a TL curve that didn't make sense. I think I accidentally captured a null in the theater.
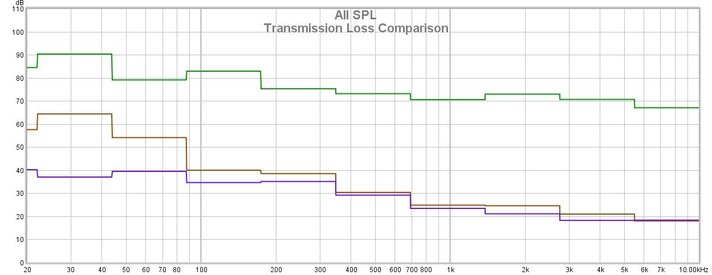
For comparison, here is a TL measurement done using the old traditional method. This method quickly ran into a noise floor problem in the receiver room.

Now a few things to keep in mind. When I did that traditional method, I had used a method to calibrate the mic that I thought was right, but turned out to be quite a bit off. About 10dB's. When I then used an actual calibrator, I realized I had made a mistake in the SPL calibration, but the relative difference doesn't change. Just add about 10dB's to those numbers to know what they should have been. In any case, you can see that the RTA method couldn't detect anything above 80hz accurately with tones at 90dB. While I haven't shared the results, I actually got fairly accurate TL results with test tones as low as 85dB's with a sine sweep. The only thing that changed when I made it louder was the area above 3khz, where TL increased a small amount once I increased the SPL to over 100dB. It was amazing how much better the SS method was for getting TL results, as compared to this traditional method.
Here is the Raw Data

The Purple is the measurements inside the theater room, Brown is the response in the room immediately adjacent to the theater. The measurements were taken roughly 6-7 feet apart. Inside the theater, about 3 feet from the wall, and outside the theater about the same distance. The green line is the transmission loss. Because this was done with a Sine Sweep measurement, I have IR's and the Green is actually the transfer function of the wall.
This can then be entered into a spreadsheet in accordance with ASTM E413 to calculate STC. I haven't actually done this manually before, so when I made this up, I did it according to that document, but am not 100% certain it is right. None the less, I believe this is right, and here are the results of that.

The flat orange line represents the STC curve I wanted to test. The others represent either the actual TL or the corrected curves of each for comparison. The wall should have been an STC of 73, but it is not shocking that I fell short of that. There are always some issues that cost you a few STC points here and there. You can see that my main losses are due to some dips between 100hz and 500hz and again above 1khz up to 2khz.
Now compared to the old method, this method doesn't allow a traditional means of spatial averaging. You can't just move a mic around while a tone plays and the RTA records (which removes the effects of resonances and smooths the response quite a bit). This smoothing is really needed for calculating STC, so to do that you have to keep rerunning the sweeps in different locations. It didn't work so well for me, so I need to play with that when I have time. I got a few odd results and averaging them gave a TL curve that didn't make sense. I think I accidentally captured a null in the theater.
For comparison, here is a TL measurement done using the old traditional method. This method quickly ran into a noise floor problem in the receiver room.

Now a few things to keep in mind. When I did that traditional method, I had used a method to calibrate the mic that I thought was right, but turned out to be quite a bit off. About 10dB's. When I then used an actual calibrator, I realized I had made a mistake in the SPL calibration, but the relative difference doesn't change. Just add about 10dB's to those numbers to know what they should have been. In any case, you can see that the RTA method couldn't detect anything above 80hz accurately with tones at 90dB. While I haven't shared the results, I actually got fairly accurate TL results with test tones as low as 85dB's with a sine sweep. The only thing that changed when I made it louder was the area above 3khz, where TL increased a small amount once I increased the SPL to over 100dB. It was amazing how much better the SS method was for getting TL results, as compared to this traditional method.


