Setting t=0

sm52

Member
Thread Starter
Joined
Mar 14, 2019
Messages
863
I understood your explanation. Could there be an alternative?
Is this correct?
REW defined point 3 as the peak of the impulse and marked it Ref. Then the point t=0 (at the picture 1), the result of IR Estimate delay, is correct.
But assuming that the impulse peak is point 4, then point 2 will be correct for t=0. It often happens that the value of the first positive peak is less than the next negative peak. And in our case, the microphone transmits uninverted data. It's been tested. So what we're seeing is not an inverse, but a direct, positive impulse that doesn't need to be inverted. So the Ref point should be where point 4 is.
 

Attachments

  • imp tw.PNG
    imp tw.PNG
    125.7 KB · Views: 21

John Mulcahy

REW Author
Joined
Apr 3, 2017
Messages
7,212
The estimation of IR delay does not depend on the location of the peak or the position of the window reference. It is generated by cross correlation of the response with a minimum phase version. That is a little difficult to see on the current build due to a bug which may draw the minimum phase impulse slightly offset from where it should be when using a timing reference, so here is an image of a correctly placed minimum phase impulse response relative to the tweeter impulse response. The minimum phase impulse is zero at all sample positions before t=0 by definition.

41645
 

sm52

Member
Thread Starter
Joined
Mar 14, 2019
Messages
863
Thanks for the explanation. Will the bug be fixed in the next build?
 

sam_adams

Member
Joined
May 23, 2017
Messages
285
Based on @John Mulcahy's explanation of the Acoustic definition of impulse start at 10% of peak, three out of the four drivers are within fractions of a μS of each other. The tweeter seems to be quite early, though.

41653


By the way, John, that's a nice little tidbit of info. Thanks.
 

sm52

Member
Thread Starter
Joined
Mar 14, 2019
Messages
863
The minimum phase impulse is zero at all sample positions before t=0 by definition.
This means that there should be a straight line on the graph of the minimum phase impulse in post # 27 until the time t = 0, and the beginning of the impulse should be at the point t = 0. But at the point t = 0, almost the peak of the impulse. It can be assumed that there is not a straight line to the point t = 0, because there is some noise level. Even so, the start of the pulse should be where the noise level reached 10% of the peak value. This is not the case on the graph.
 

sm52

Member
Thread Starter
Joined
Mar 14, 2019
Messages
863
In which picture is the most realistic t = 0?
 

Attachments

  • 4 impulses est IR delay.PNG
    4 impulses est IR delay.PNG
    98.1 KB · Views: 8
  • 4 impulses max magn.PNG
    4 impulses max magn.PNG
    101.4 KB · Views: 9
  • 4 impulses min noise.PNG
    4 impulses min noise.PNG
    103.8 KB · Views: 9

John Mulcahy

REW Author
Joined
Apr 3, 2017
Messages
7,212
Thanks for the explanation. Will the bug be fixed in the next build?
Yes, I have already fixed it.

This means that there should be a straight line on the graph of the minimum phase impulse in post # 27 until the time t = 0, and the beginning of the impulse should be at the point t = 0. But at the point t = 0, almost the peak of the impulse. It can be assumed that there is not a straight line to the point t = 0, because there is some noise level. Even so, the start of the pulse should be where the noise level reached 10% of the peak value. This is not the case on the graph.
No, that is not what is means. The minimum phase impulse is zero at all sample positions before t=0. The level at t=0 depends on the signal bandwidth, with signals whose bandwidth is close to the measurement bandwidth that level may be at or close to the peak level. For a pure impulse the peak will be at t=0. The graph between the sample points is generated using band limited reconstruction, per the Shannon sampling theorem.
 

sm52

Member
Thread Starter
Joined
Mar 14, 2019
Messages
863
with signals whose bandwidth is close to the measurement bandwidth that level may be at or close to the peak level. For a pure impulse the peak will be at t=0.
Looking at the graph of the tweeter, its bandwidth is half the measurement bandwidth, but t = 0 is close to the peak. And on the graph of the mid, whose bandwidth is almost the full measurement bandwidth, t = 0 turns out to be closer to the beginning of the impulse. So it's not clear yet.
 

John Mulcahy

REW Author
Joined
Apr 3, 2017
Messages
7,212
I was using "bandwidth" loosely to refer to the high frequency extension of the source. The greater the high frequency extension the faster the IR rises and vice versa.
 

sm52

Member
Thread Starter
Joined
Mar 14, 2019
Messages
863
Now it is clear. A faster rise IR means a change the slope of the first abrupt rise of the IR graph. It remains unclear, if use 'Etimate IR delay', why t = 0 for the tweeter is close to the peak, and for the mid or midbass it is close to the beginning of the first abrupt rise of the IR graph.
 

jtalden

Senior Member
Joined
May 22, 2017
Messages
887
Location
Arizona, USA
More  
Preamp, Processor or Receiver
Marantz AV7705 Pre/Pro
Main Amp
VTV 6 chnl NC252MP P-amp x 2
Additional Amp
Behringer DCX2496 x 2
Universal / Blu-ray / CD Player
OPPO BDP-103 Universal Player
Front Speakers
DIY SEAS H1456/H1212 Spkr x 5
Subwoofers
DIY JBL 2235H 15" SW x 2
Video Display Device
JVC DLA-X790R
Screen
Da-Lite Da-Snap 39105V - 92"
@sm52
What am I missing here? Why does it matter where t=0 is placed? What is your objective?

Regarding XO driver timing:
The relative offset of the 2 drivers is important. It is not important where t=0 is located. The loopback or acoustic timing feature provides the correct current relative timing during the measurement process. An analysis will result in the same exact timing change needed no matter where t=0 was positioned. The job of timing analysis is easier if we choose to locate t=0 someplace near the impulse of the higher frequency driver however, if we chose; first rise, peak, a little before first rise, or a little after the peak it will not change the ease of analysis or the result of the analysis.

I can understand that a manufacturer's charts for sales for a drive phase response should have some standardized t=0 positioning, but setting that aside that case, are there other cases am I not thinking of?

Posted phase charts for speaker system responses seen here and elsewhere tend to most often have the phase flatten out near 0° for the highest measured frequencies. This is a common convention. There are all sorts of other decisions made for t=0 in thes charts that also are easily found. Those interested in the phase response just need to understand the impact of a t=0 shift to make sense of the various charts.
 

sm52

Member
Thread Starter
Joined
Mar 14, 2019
Messages
863
jtalden
depending on where we choose t=0 depends the phase response shift for the same amplitude response. That is, the offset t = 0 almost does not change the frequency response, but shifts the phase response. And, if it is wrong to shift the phase response of two or more drivers working at the same time, there will be either a pit (pits) on the frequency response, or a hump (humps), which should not be. Designing a crossover based on incorrect measurements would mean that the crossover would not designed correctly. The loopback or acoustic timing feature with multiple checks, when 10 (not 1-2) measurements are made in a row under constant conditions, does not give 'Estimated delay is zero' every time. But they must gave. Because of these observations, there was a desire to manually set t = 0. To do this, you need to know the rules. How to do it correctly.
 

jtalden

Senior Member
Joined
May 22, 2017
Messages
887
Location
Arizona, USA
More  
Preamp, Processor or Receiver
Marantz AV7705 Pre/Pro
Main Amp
VTV 6 chnl NC252MP P-amp x 2
Additional Amp
Behringer DCX2496 x 2
Universal / Blu-ray / CD Player
OPPO BDP-103 Universal Player
Front Speakers
DIY SEAS H1456/H1212 Spkr x 5
Subwoofers
DIY JBL 2235H 15" SW x 2
Video Display Device
JVC DLA-X790R
Screen
Da-Lite Da-Snap 39105V - 92"
If the acoustic or loopback t=0 position changes significantly with repeated measurements on a driver then there is a problem with the measurement setup. It is not possible to correct this problem with manual t=0 position adjustments. The measurement problem itself needs to be corrected. Very small variations is expected and is trivial. Some of your posts show trivial differences. If you have problem with repeatability that is what needs attention. Provide an example of 5 to 10 measurements of a TW at 1 m mic distance from the measurement speaker baffle. The timing reference TW should be set to the speaker in the other channel. If the shift in t=0 creates a phase shift less than a few degrees at the XO frequency it is trivial.

Again, note that manually changing t=0 does not change the phase response any more than it changes the SPL response (no change at all). The phase chart trace will roll up or down at the high frequencies, but that does not change actual phase response. It only reflects the impact of moving the chosen t=0 position from which the phase was calculated. If a similar shift of t=0 is made to both TW and MR drivers in a XO analysis the same apparent phase shift applies to both drivers and the relative timing between the 2 is not changed.

It is just wrong to manually change t=0 location on any individual driver impulse being used with another driver to determine if an XO timing change is needed.

Further, the measurements you posted above were not the correct ones to adjust the timing delay needed between the drivers. Measure a TW and MR at 1 m with the XO filters active. Then analyze and adjust the timing of those 2 drivers. Similarly a MR and W can be done this way (or any other drivers on the same baffle). Normally W and SW measurements need to be at the LP as the SW are not located on the same baffle. Unfortunately the room impact on phase makes it more difficult to do the analysis with that mic position.
 

sm52

Member
Thread Starter
Joined
Mar 14, 2019
Messages
863
After a while I will make 10 measurements in a row TW and MR. I agree about the insignificance of a difference of several degrees in the phase response. I agree that the joint measurements of several drivers were made incorrectly. But. I didn't need to get one driver's latency from another. The measurements were carried out from one point in space (microphone) under the same conditions. So they remain useful to me.
Do you have measurements of several drivers (maybe two) located on the same speaker baffle in a way that you think is correct? Can I take a look at them?
 

jtalden

Senior Member
Joined
May 22, 2017
Messages
887
Location
Arizona, USA
More  
Preamp, Processor or Receiver
Marantz AV7705 Pre/Pro
Main Amp
VTV 6 chnl NC252MP P-amp x 2
Additional Amp
Behringer DCX2496 x 2
Universal / Blu-ray / CD Player
OPPO BDP-103 Universal Player
Front Speakers
DIY SEAS H1456/H1212 Spkr x 5
Subwoofers
DIY JBL 2235H 15" SW x 2
Video Display Device
JVC DLA-X790R
Screen
Da-Lite Da-Snap 39105V - 92"
Okay,
  • Set 48k sample rate and acoustic timing in REW.
  • FL is measurement and FR is reference channel.
  • Set mic 30 inches from FL speaker (better to move speaker further away from boundaries for cleanest measurements, but instead used tighter window limits and FDW to window out the room as much a possible).
Mic location overview
41761


Mic height is on my listening axis. It's out of sight here, it's just above the frame of the MR driver:
41762


20 SPL: [10 TWs (red) and 10 MRs (blue)]
(XO range 500 Hz to 7 kHz for about 40 dB SPL of separation)
41759


20 Impulses without windowing:
(First reflection is at about 2.2 ms.)
41760


1 Windowed Impulse (an example):
41763


20 Windowed Phase:
(close phase tracking 500 to 7k)
41764


20 Group Delay:
41765


Attached mdat file contains first measurement of TW and MR.
 

Attachments

  • One TW and MR at 30 in.mdat
    1.2 MB · Views: 14

sm52

Member
Thread Starter
Joined
Mar 14, 2019
Messages
863
jtalden
Thank you. I looked. I'll try to do the same. But it won't work out very quickly. I was surprised by the very small window - 2.4ms. I understand that this is before the first reflection. But I would skip further. The repeatability is good. Only the MR phase on the HF floats.
 

jtalden

Senior Member
Joined
May 22, 2017
Messages
887
Location
Arizona, USA
More  
Preamp, Processor or Receiver
Marantz AV7705 Pre/Pro
Main Amp
VTV 6 chnl NC252MP P-amp x 2
Additional Amp
Behringer DCX2496 x 2
Universal / Blu-ray / CD Player
OPPO BDP-103 Universal Player
Front Speakers
DIY SEAS H1456/H1212 Spkr x 5
Subwoofers
DIY JBL 2235H 15" SW x 2
Video Display Device
JVC DLA-X790R
Screen
Da-Lite Da-Snap 39105V - 92"
Only the MR on the HF floats.

Look at the MR phase chart. To I don't see any 'float'. All 10 MR traces are on top of each other all the way to 7 kHz. That is 40 dB down and at the very top end of the 2 kHz XO range. The scatter above 9 kHz is where the SPL is near the noise floor, 55 dB down. REW can't measure accurately into the measurement noise floor so that portion of all traces needs to be ignored.
 

jtalden

Senior Member
Joined
May 22, 2017
Messages
887
Location
Arizona, USA
More  
Preamp, Processor or Receiver
Marantz AV7705 Pre/Pro
Main Amp
VTV 6 chnl NC252MP P-amp x 2
Additional Amp
Behringer DCX2496 x 2
Universal / Blu-ray / CD Player
OPPO BDP-103 Universal Player
Front Speakers
DIY SEAS H1456/H1212 Spkr x 5
Subwoofers
DIY JBL 2235H 15" SW x 2
Video Display Device
JVC DLA-X790R
Screen
Da-Lite Da-Snap 39105V - 92"
The 2.2 ms narrow window is because I didn't move the speaker to a stand away from barriers - as mentioned. Opening the window anyway is fine in that we can still do an accuracy timing analysis for this XO. I just wanted to show the best practice principle of avoiding room effects that can make it look like there is phase scatter when there is none in the direct sound.
 

sm52

Member
Thread Starter
Joined
Mar 14, 2019
Messages
863
jtalden
do the IR Window settings affect the analysis of the loaded characteristics or also the subsequent measurements?
The Ref point is at t = 0, not at the peak. What is the difference?
 

jtalden

Senior Member
Joined
May 22, 2017
Messages
887
Location
Arizona, USA
More  
Preamp, Processor or Receiver
Marantz AV7705 Pre/Pro
Main Amp
VTV 6 chnl NC252MP P-amp x 2
Additional Amp
Behringer DCX2496 x 2
Universal / Blu-ray / CD Player
OPPO BDP-103 Universal Player
Front Speakers
DIY SEAS H1456/H1212 Spkr x 5
Subwoofers
DIY JBL 2235H 15" SW x 2
Video Display Device
JVC DLA-X790R
Screen
Da-Lite Da-Snap 39105V - 92"
do the IR Window settings affect the analysis of the loaded characteristics or also the subsequent measurements?
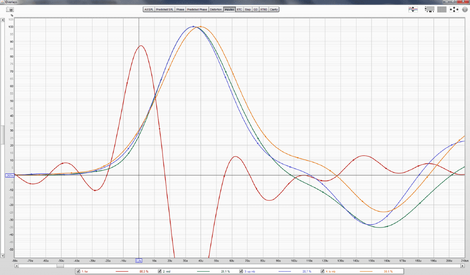
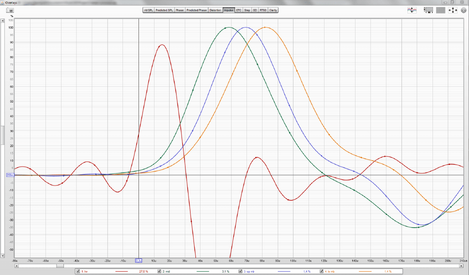
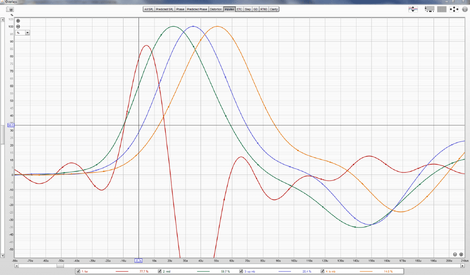
Duh, yes. The window settings impact which portion of the IR data is used so charts look differently when windowed than when unwindowed. Done properly, it can make the analysis much easier. Done wrong, it uses the wrong data and will not lead to correct analysis. Speaker and Mic placement has a similar impact. There is no need to worry too much about windowing if that is done correctly. Trying to analyze TW-MR XO timing from the LP more difficult than than shown here, but can still be done given some experience. Why make it harder though? See here for general background.

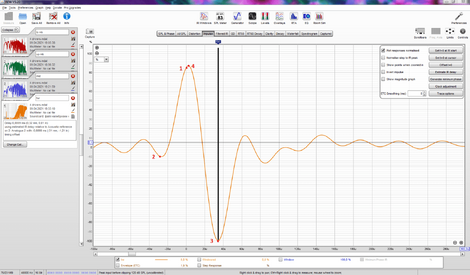
Change the window settings on the mdat I provided and see how the SPL, phase and delay timing is impacted. A few words here will not explain the situation as well as a little experimentation on your part.
The Ref point is at t = 0, not at the peak. What is the difference?
I thought we covered this several times. The difference is the phase chart and some of other charts are shifted (rotated in the case of the phase). There is no difference in analysis for the purposes of delay timing. Please move t=0 on both measurements the same amount and redo a timing analysis. The relative phase tracking will be unchanged. Again, there is no reason not to try it as see the impact for yourself. Move t=0 to the peak and the relative phase tracking can still be easily read. Move it 1 mm and it can still be read, but the chart gets awfully crowded. Then open the right window up to let more of the room influence into the phase traces and the it is even more difficult to read. Please experiment.

There is a theme here if you haven't seen it yet. Stop repeatedly asking questions like 'what happens if t=0 is in a different place' and other questions that are way too general. Instead experiment yourself and ask us to clarify a specific detail. Provide the background and information like the mdat and charts marked to explain the question clearly. If you don't have the time to do that, then think of us who are trying to read your mind and figure out what portion of 'what happens when t=0 is in a different place' you are still struggling with for the 3rd or 5th time.

It took you 3 minutes to repeat basically the same vague questions and did not even bother to capitalize the sentence or explain what is meant by 'loaded characteristics'. I assumed you meant 'loaded measurements'.

I like to help, but I'm done with overly vague poorly worded questions. I'm still willing to try to answer more detailed questions where you have spent some better effort to clearly explain.
 

sm52

Member
Thread Starter
Joined
Mar 14, 2019
Messages
863
I agree that I need to experiment more. You guessed correctly what I meant. Loaded measurements.
Thank you very much for your answers and for your time.
 

sm52

Member
Thread Starter
Joined
Mar 14, 2019
Messages
863
I took 10 measurements in a row. First I set the microphone at the same distance from the tweeters. Therefore, in the first measurements, the timing offset was = 0. Then there was a shift of 7.3 mm. I made a correction. And then I made 10 measurements in a row. 7 measurements are almost the same. Then again there was a shift.
Can someone explain why this is happening? The offset is always a multiple of 7-7.2 mm.
 

Attachments

  • tw1-5 acus ref.mdat
    11.8 MB · Views: 6
  • tw6-10 acus ref.mdat
    11.8 MB · Views: 5

jtalden

Senior Member
Joined
May 22, 2017
Messages
887
Location
Arizona, USA
More  
Preamp, Processor or Receiver
Marantz AV7705 Pre/Pro
Main Amp
VTV 6 chnl NC252MP P-amp x 2
Additional Amp
Behringer DCX2496 x 2
Universal / Blu-ray / CD Player
OPPO BDP-103 Universal Player
Front Speakers
DIY SEAS H1456/H1212 Spkr x 5
Subwoofers
DIY JBL 2235H 15" SW x 2
Video Display Device
JVC DLA-X790R
Screen
Da-Lite Da-Snap 39105V - 92"
I don't know why it's happening.
Below are general comments/observations just FYI:
I took 10 measurements in a row. First I set the microphone at the same distance from the tweeters. Therefore, in the first measurements, the timing offset was = 0. Then there was a shift of 7.3 mm. I made a correction. And then I made 10 measurements in a row. 7
I have no idea why you bothered to do it this way, but I don't think this caused any problem if the mic was not moved from in front of the measurement speaker for these 10 measurements. How far from the TW was the mic for the 10 measurements?

Why is there up to 1 dB of SPL variation across the 2 - 7 kHz range? This is not normal. Noisy/reflective room?
41826


Why is there significant 50 Hz from mains power leaking into the measurement?
41827


The phase shift at 2 kHz is maybe 10° and maybe 60° at 7 kHz. probably usable for 2 kHz XO, but not ideal - should be better.
41828


Significant reflections at 1, 2 and 3 ms?
41830


The timing offset for measurements 8, 9 and 10 appears to be 2 samples - more than expected.
41831


The room is very live - at the 600m max for a listening environment and not very favorable for these measurements.
41832


I don't think any of these observations address the question directly, but are thinks that I would investigate and mitigate if possible.
 

sm52

Member
Thread Starter
Joined
Mar 14, 2019
Messages
863
All of your conclusions are correct. But now I would like to solve the issue of spontaneous displacement.
 

jtalden

Senior Member
Joined
May 22, 2017
Messages
887
Location
Arizona, USA
More  
Preamp, Processor or Receiver
Marantz AV7705 Pre/Pro
Main Amp
VTV 6 chnl NC252MP P-amp x 2
Additional Amp
Behringer DCX2496 x 2
Universal / Blu-ray / CD Player
OPPO BDP-103 Universal Player
Front Speakers
DIY SEAS H1456/H1212 Spkr x 5
Subwoofers
DIY JBL 2235H 15" SW x 2
Video Display Device
JVC DLA-X790R
Screen
Da-Lite Da-Snap 39105V - 92"
If you can't correct the acoustic timing issues, an XLR mic and that Audient interface would allow use of loopback timing. That is likely to be more reliable.
 
Top Bottom