Measuring with a timing reference

jtalden

Senior Member
Joined
May 22, 2017
Messages
887
Location
Arizona, USA
More  
Preamp, Processor or Receiver
Marantz AV7705 Pre/Pro
Main Amp
VTV 6 chnl NC252MP P-amp x 2
Additional Amp
Behringer DCX2496 x 2
Universal / Blu-ray / CD Player
OPPO BDP-103 Universal Player
Front Speakers
DIY SEAS H1456/H1212 Spkr x 5
Subwoofers
DIY JBL 2235H 15" SW x 2
Video Display Device
JVC DLA-X790R
Screen
Da-Lite Da-Snap 39105V - 92"
Corrected Post - again sorry

John's statement:
"the first peak at about 885 us the sound travelled an extra 343 m/s * 885 us = 304 mm. 304 mm is the wavelength for 1130Hz"

Check your math:
First PeakExtra DistanceFrequency
smHz
John's Example0.0008850.3041130
sm52 question0.02026.92949.50

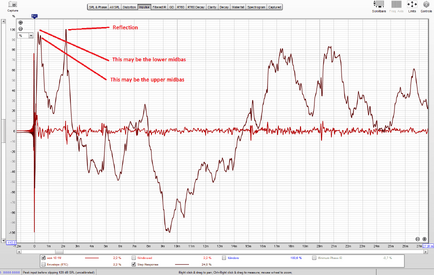
John applied this math to an early wall reflection. It is clear a 20 ms reflection is not early in your data. The sound energy at 20.2 ms is the result of all the room effects that occur at that time and space.
 
Last edited:

sm52

Member
Thread Starter
Joined
Mar 14, 2019
Messages
863
I am not yet convinced that in the impulse response graph, the time from the peak of the test pulse to the peak of the reflection tells us the frequency of the reflection. This time tells us the extra distance that the non-direct sound flew after the direct sound has reached the microphone. This distance can be used to determine where the reflection occurs in the room. For example, I see the first reflection in time as an increased momentum relative to the previous one. This happened in 0.954 ms. 0.000954 * 343 = 0.327 m. At this distance from the tweeter was the corner of the computer monitor during the measurement. The distance from this corner of the monitor to the microphone is the same as from the tweeter to the microphone. The sound flew an additional 0.327 m. So this is confirmation. And we can also say that this reflection is 29 dB quieter than the main impulse.
 

Attachments

  • First reflection.PNG
    First reflection.PNG
    144.8 KB · Views: 13
Last edited:

sm52

Member
Thread Starter
Joined
Mar 14, 2019
Messages
863
Wavelet graph. On the right, a scale is shown, where the places of the highest sound energy are indicated in red, and the lowest in blue. The tweeter graph from 2.5 kHz has a level of about 90 dB. Everything up to 2.5 kHz has a level lower or much lower. But on the wavelet, the reddest places at time 0 s from 300 to 600 Hz. And in 16-20 ms from 130 Hz to 330 Hz. How to understand this?
 

John Mulcahy

REW Author
Joined
Apr 3, 2017
Messages
7,212
I am not yet convinced that in the impulse response graph, the time from the peak of the test pulse to the peak of the reflection tells us the frequency of the reflection.
A reflection does not have "a frequency". The reflection adds to the direct sound, the effect of the reflection on the frequency response depends on the extra distance it has travelled according to the phase shift that distance represents at each frequency. The largest effects (full summation or full subtraction) occur at frequencies where the distance corresponds to a multiple of 180 degrees phase shift. In an earlier post I explained how to determine those frequencies.
 

John Mulcahy

REW Author
Joined
Apr 3, 2017
Messages
7,212
Wavelet graph. On the right, a scale is shown, where the places of the highest sound energy are indicated in red, and the lowest in blue. The tweeter graph from 2.5 kHz has a level of about 90 dB. Everything up to 2.5 kHz has a level lower or much lower. But on the wavelet, the reddest places at time 0 s from 300 to 600 Hz. And in 16-20 ms from 130 Hz to 330 Hz. How to understand this?
It is not reasonable to expect anyone to comment on your few words describing an image. Post the image and the settings used to generate it to give folk some chance.
 

sm52

Member
Thread Starter
Joined
Mar 14, 2019
Messages
863
Recent posts discuss tweeter measurements, mdat file in post # 98.
 

Attachments

  • wavelet tweeter.PNG
    wavelet tweeter.PNG
    381.8 KB · Views: 17
  • tweeter.mdat
    2.4 MB · Views: 8

jtalden

Senior Member
Joined
May 22, 2017
Messages
887
Location
Arizona, USA
More  
Preamp, Processor or Receiver
Marantz AV7705 Pre/Pro
Main Amp
VTV 6 chnl NC252MP P-amp x 2
Additional Amp
Behringer DCX2496 x 2
Universal / Blu-ray / CD Player
OPPO BDP-103 Universal Player
Front Speakers
DIY SEAS H1456/H1212 Spkr x 5
Subwoofers
DIY JBL 2235H 15" SW x 2
Video Display Device
JVC DLA-X790R
Screen
Da-Lite Da-Snap 39105V - 92"
Deselect the option in controls to normalize to peak a each frequency as this is misleading you. Post-99 shows the result of this.
 

sm52

Member
Thread Starter
Joined
Mar 14, 2019
Messages
863
Here is a waterfall of the same tweeters measurement. It shows that frequencies from 1 kHz to 24 kHz at the moment of 0 s have an energy above 85 dB. And even after 300 ms no reflections appear with the same or close level. This is true. And on the Wavelet plot there is an area after 20 ms, which has a level of 95 dB according to the scale on the right. And there are a lot of red areas in the low frequency range. In reality, room noise is much quieter than the test tone at the tweeter's operating frequency.
 

Attachments

  • waterfall tweeter.PNG
    waterfall tweeter.PNG
    268 KB · Views: 13

jtalden

Senior Member
Joined
May 22, 2017
Messages
887
Location
Arizona, USA
More  
Preamp, Processor or Receiver
Marantz AV7705 Pre/Pro
Main Amp
VTV 6 chnl NC252MP P-amp x 2
Additional Amp
Behringer DCX2496 x 2
Universal / Blu-ray / CD Player
OPPO BDP-103 Universal Player
Front Speakers
DIY SEAS H1456/H1212 Spkr x 5
Subwoofers
DIY JBL 2235H 15" SW x 2
Video Display Device
JVC DLA-X790R
Screen
Da-Lite Da-Snap 39105V - 92"
My hobbyist sense of this is that the math and available settings is different for the charts so they will never have a direct 1:1 relationship. Different charts are better at shedding light on different aspects of the measurement. The apparent correlation between the charts depends on the settings we pick. Different smoothing and time range setting will have a significant impact. Below are some charts that help to illustrate this. I suggest you find some reference material if you want to dig deeper into these differences as I don't really understand the subtilties of this and suspect that the correct explanation to the differences will quickly start discussing the math.

Also, in looking at your measurement, it appears that the tweeter was measured in a very resonate environment. It appears worse than most typical room setups I have seen and is not in anyway a reflection of what the TW's anechoic response would be. It may by fine if this is just used to investigate the various charts, but a better measurement environment may be more helpful if you are looking for any helpful information.

37388


37389


37390


37392
 

sm52

Member
Thread Starter
Joined
Mar 14, 2019
Messages
863
Deselect the option in controls to normalize to peak a each frequency as this is misleading you. Post-99 shows the result of this.
In post # 99 in the screenshot I saw the 'Peak energy time' setting, I took it off. I did not see any changes. And I decided that you do not understand what I am asking. And only in post # 109 on the last screenshot I saw what you wrote about. 'normalize to peak at each frequency'. I took it off and got the right picture. No higher mathematics. Thank you for the clarification and for your patience.

Also, in looking at your measurement, it appears that the tweeter was measured in a very resonate environment.
Tweeter measurement. I did not use a divider for the stronger test signal. I was afraid to ruin the tweeter. Therefore, I gave a weaker test signal.
 
Last edited:

sm52

Member
Thread Starter
Joined
Mar 14, 2019
Messages
863
There is a measurement. Is it possible by looking and comparing two graphs - wavelet and impulse - to tell the distance from the speaker to the reflection point and the frequency of the reflection wave?
 

Attachments

  • ноя 16 1М.mdat
    2.4 MB · Views: 9

jtalden

Senior Member
Joined
May 22, 2017
Messages
887
Location
Arizona, USA
More  
Preamp, Processor or Receiver
Marantz AV7705 Pre/Pro
Main Amp
VTV 6 chnl NC252MP P-amp x 2
Additional Amp
Behringer DCX2496 x 2
Universal / Blu-ray / CD Player
OPPO BDP-103 Universal Player
Front Speakers
DIY SEAS H1456/H1212 Spkr x 5
Subwoofers
DIY JBL 2235H 15" SW x 2
Video Display Device
JVC DLA-X790R
Screen
Da-Lite Da-Snap 39105V - 92"
There is a measurement. Is it possible by looking and comparing two graphs - wavelet and impulse - to tell the distance from the speaker to the reflection point and the frequency of the reflection wave?
Yes, As explained above the impulse and/or the spectrogram helps to identify the extra path length that the reflected sound traveled. Half that distance is the distance from the speaker to the area of the reflection off the wall. In this case the early reflection arrival times are at about 0.889, 2.26, and 4.79 ms.
Some people use a string the length equal to the distance from speaker to mic (direct sound) plus the extra path length long to help identify the surface and reflection point. With the ends held at the speaker and the mic the middle point of the string will just reach the reflection point when the slack is removed. Maybe this will help you visualize the concept.

The calculation for lowest frequency to show strong SPL reinforcement was shown previously. All the harmonics of that fundamental will also be augmented. This thus results in a horizontal ridge across the spectrogram at that time.
1 Impulse Reflections.jpg 2 Spectrogram.jpg
 

Breeman

Member
Joined
Jan 9, 2019
Messages
151
Yes, As explained above the impulse and/or the spectrogram helps to identify the extra path length that the reflected sound traveled. Half that distance is the distance from the speaker to the area of the reflection off the wall. In this case the early reflection arrival times are at about 0.889, 2.26, and 4.79 ms.
Some people use a string the length equal to the distance from speaker to mic (direct sound) plus the extra path length long to help identify the surface and reflection point. With the ends held at the speaker and the mic the middle point of the string will just reach the reflection point when the slack is removed. Maybe this will help you visualize the concept.

The calculation for lowest frequency to show strong SPL reinforcement was shown previously. All the harmonics of that fundamental will also be augmented. This thus results in a horizontal ridge across the spectrogram at that time.
View attachment 37665 View attachment 37666
Your spectrogram looks nice and detailed jtalden. What parameters did you use?
 

sm52

Member
Thread Starter
Joined
Mar 14, 2019
Messages
863
Half that distance is the distance from the speaker to the area of the reflection off the wall.
Sometimes it is, sometimes it is not. When the room has parallel walls, it is. Otherwise, if the walls are not parallel, or there are several of them on one side, it is not. If we assume the distance from the speaker to the wall + from the wall to the microphone is 3 m, then it can be 0.5 m + 2.5 m. In any case, the method with a string will show it.
I managed to repeat the 'Spectrogram' graph with your settings. It turns out very well. The first 'Impulse' graph from REW?
 

jtalden

Senior Member
Joined
May 22, 2017
Messages
887
Location
Arizona, USA
More  
Preamp, Processor or Receiver
Marantz AV7705 Pre/Pro
Main Amp
VTV 6 chnl NC252MP P-amp x 2
Additional Amp
Behringer DCX2496 x 2
Universal / Blu-ray / CD Player
OPPO BDP-103 Universal Player
Front Speakers
DIY SEAS H1456/H1212 Spkr x 5
Subwoofers
DIY JBL 2235H 15" SW x 2
Video Display Device
JVC DLA-X790R
Screen
Da-Lite Da-Snap 39105V - 92"
Yes, of course.
 

jtalden

Senior Member
Joined
May 22, 2017
Messages
887
Location
Arizona, USA
More  
Preamp, Processor or Receiver
Marantz AV7705 Pre/Pro
Main Amp
VTV 6 chnl NC252MP P-amp x 2
Additional Amp
Behringer DCX2496 x 2
Universal / Blu-ray / CD Player
OPPO BDP-103 Universal Player
Front Speakers
DIY SEAS H1456/H1212 Spkr x 5
Subwoofers
DIY JBL 2235H 15" SW x 2
Video Display Device
JVC DLA-X790R
Screen
Da-Lite Da-Snap 39105V - 92"
It's fine to use the spikes in the DBFS format of the impulse chart that you posted. It provides the same timing information. If you want to see the format I chose select the drop down option '%' instead of 'DBFS' in the corner of the chart.
 

sm52

Member
Thread Starter
Joined
Mar 14, 2019
Messages
863
I managed. Thank you. The screenshot shows IR + Step Response. 4 speakers + bass reflex port. Can you specify which peaks correspond to each sound source? Measurement from post # 111.
 

Attachments

  • StepR+Imp.PNG
    StepR+Imp.PNG
    64.2 KB · Views: 17

jtalden

Senior Member
Joined
May 22, 2017
Messages
887
Location
Arizona, USA
More  
Preamp, Processor or Receiver
Marantz AV7705 Pre/Pro
Main Amp
VTV 6 chnl NC252MP P-amp x 2
Additional Amp
Behringer DCX2496 x 2
Universal / Blu-ray / CD Player
OPPO BDP-103 Universal Player
Front Speakers
DIY SEAS H1456/H1212 Spkr x 5
Subwoofers
DIY JBL 2235H 15" SW x 2
Video Display Device
JVC DLA-X790R
Screen
Da-Lite Da-Snap 39105V - 92"
I managed. Thank you. The screenshot shows IR + Step Response. 4 speakers + bass reflex port. Can you specify which peaks correspond to each sound source? Measurement from post # 111.
??
Example reflections of post-111 were already identified in post-112.
 

sm52

Member
Thread Starter
Joined
Mar 14, 2019
Messages
863
I see examples of reflections. I asked about the response of the speakers on the SR graph.
 

jtalden

Senior Member
Joined
May 22, 2017
Messages
887
Location
Arizona, USA
More  
Preamp, Processor or Receiver
Marantz AV7705 Pre/Pro
Main Amp
VTV 6 chnl NC252MP P-amp x 2
Additional Amp
Behringer DCX2496 x 2
Universal / Blu-ray / CD Player
OPPO BDP-103 Universal Player
Front Speakers
DIY SEAS H1456/H1212 Spkr x 5
Subwoofers
DIY JBL 2235H 15" SW x 2
Video Display Device
JVC DLA-X790R
Screen
Da-Lite Da-Snap 39105V - 92"
??
I don't understand what your looking for. Can you provide some context? Possibly a reference to something that raised the question.
 

sm52

Member
Thread Starter
Joined
Mar 14, 2019
Messages
863
On the Step Response graph, when multiple speakers are operating simultaneously, you can see how the responses from each speaker are separated over time. If during the development and design of acoustics they were not well coordinated with each other. That is, midbass can lag slightly behind mid, mid from tweeter. But I haven't learned to define it. Others can.
 

Attachments

  • StepR+Imp2.png
    StepR+Imp2.png
    66.1 KB · Views: 15

jtalden

Senior Member
Joined
May 22, 2017
Messages
887
Location
Arizona, USA
More  
Preamp, Processor or Receiver
Marantz AV7705 Pre/Pro
Main Amp
VTV 6 chnl NC252MP P-amp x 2
Additional Amp
Behringer DCX2496 x 2
Universal / Blu-ray / CD Player
OPPO BDP-103 Universal Player
Front Speakers
DIY SEAS H1456/H1212 Spkr x 5
Subwoofers
DIY JBL 2235H 15" SW x 2
Video Display Device
JVC DLA-X790R
Screen
Da-Lite Da-Snap 39105V - 92"
Okay, thanks.
The easy way to see the relative contribution of each speaker is to use the overlay of step chart. Measure each speaker alone and both together. Clear the normalize options in controls for the overlay step chart . The 2 impulses will get tiny or disappear - no problem. Now place the cursor on the 0 % horizontal line and expand the vertical scale until the impulse shapes are back to size. This is the contribution of the 2 individual drivers and combined result for the step response. With a distant mic measurement the result can look messy due to room effects, but we can also set a FDW of about 4 cycles to better see the impact of the direct sound.

Below is an example showing the 2 individual drivers only. To see how they add I could have turned on the combined step as well.

Usually this is done with 1 m mic measurements, but it usually works well enough with a LP measurement like this to see the direct sound trends.
37796
 
Top Bottom