Measuring with a timing reference

John Mulcahy

REW Author
Joined
Apr 3, 2017
Messages
7,212
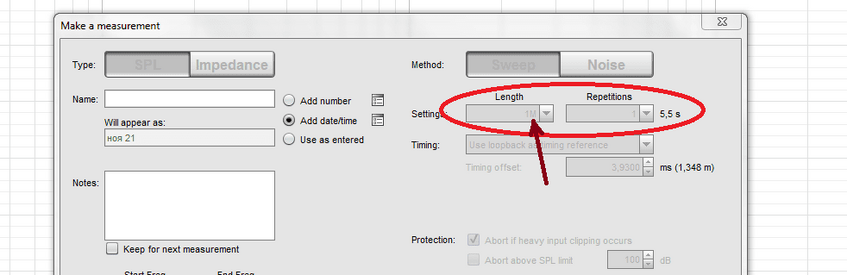
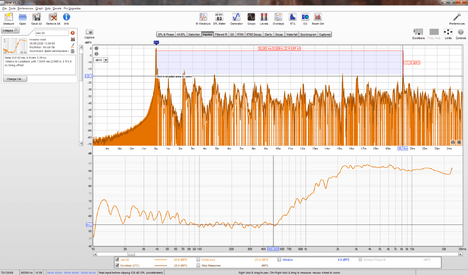
The frequency resolution of the measurement is not affected, it will be 0.366 Hz (for 48 kHz sampling) in either case.
 

sm52

Member
Thread Starter
Joined
Mar 14, 2019
Messages
863
OK. If Length = 4M, measurement duration = 87.4 s. Do I understand correctly that at this duration, as well as at 43.7 s (L = 2M), the microphone will catch a bunch of reflections? What is not good.
 

John Mulcahy

REW Author
Joined
Apr 3, 2017
Messages
7,212
In-room measurements include reflections, the sweep length is irrelevant. They can be excluded by suitably narrow windows applied to the impulse response. To understand how sweep measurement works look at this paper, which also reviews various other methods and their merits.
 

John Mulcahy

REW Author
Joined
Apr 3, 2017
Messages
7,212
To exclude reflections you need to see where they are, typically by looking at the impulse response envelope. As a rough figure you could use the time taken to travel twice the distance to whichever surface is nearest to the source or the mic. For pseudo-anechoic measurements it is best to move source and mic as far away from room surfaces as possible.
 

sm52

Member
Thread Starter
Joined
Mar 14, 2019
Messages
863
For example, here's a measurement. How to determine reflections from the impulse response envelope? I suppose I should have dealt with such questions myself, but very want to learn quicker.
 

Attachments

  • ноя 12 0.5М.mdat
    2.4 MB · Views: 12
Last edited:

John Mulcahy

REW Author
Joined
Apr 3, 2017
Messages
7,212
Nyal Mellor wrote an article about that. To see the effect of changing the window to include or exclude reflections go to the impulse graph and select "Show magnitude graph" in the controls. Set the impulse response time span to about 20 ms and the impulse response right hand window to 10 ms, so that you can see the "R" maker at the top of the graph showing the extent of the window. Then drag that R marker and see how the response changes as you pass various reflection spikes.

36847
 

sm52

Member
Thread Starter
Joined
Mar 14, 2019
Messages
863
Thank you John. I read Nyal's article. But it looks like a first grader was given to study an equation with three unknowns. It takes time, I'll try.

I have reproduced the picture you have in REW. I moved the R marker. Marker to the left - decrease the impulse response time, marker to the right - increase. Left - less data, magnitude plot is cropped at a higher frequency. To the right - at a lower frequency. How do you know where the peaks of the reflections are, and not the direct signal? At what time point is the first peak of the reflections?
 
Last edited:

John Mulcahy

REW Author
Joined
Apr 3, 2017
Messages
7,212
The direct signal is the biggest peak at the start, where the Ref is. The reflections are the peaks after that.
 

sm52

Member
Thread Starter
Joined
Mar 14, 2019
Messages
863
First peak of reflections at 0.925 ms. Second 2.21 ms. Third 4.74 ms. I don't see frequencies on the magnitude graph that rise as R moves through these 3 points. I see that due to the increase-decrease in the amount of data, the magnitude graph becomes more detailed, less detailed. Can you name the frequencies that caused these three reflection peaks?
 

John Mulcahy

REW Author
Joined
Apr 3, 2017
Messages
7,212
Reflections are caused by sound bouncing off room surfaces. The time to the reflection from the peak of the direct sound indicates how much further the sound travelled on its way to the mic, so for the first peak at about 885 us the sound travelled an extra 343 m/s * 885 us = 304 mm. 304 mm is the wavelength for 1130Hz, that extra distance will correspond to 1 full cycle (360 degrees) of phase shift at 1130 Hz and so it will add constructively to the direct sound at 1130 Hz and its multiples. The reflection is about 20 dB below the direct sound, so the effect is not very large, only increasing the level by just under 1 dB. 304 mm is half a cycle, 180 degrees, for 565 Hz, so the reflection will add destructively at 565 Hz and its odd multiple (1695 Hz, 2825 Hz etc) reducing the level at those frequencies, again by just under 1 dB. The overall effect is to create a ripple in the response, a little under 2 dB peak to peak, spaced at 1130 Hz intervals. The same occurs for other reflections.
 

sm52

Member
Thread Starter
Joined
Mar 14, 2019
Messages
863
As I understand it, if the reflection peak is -20 dB from the signal peak and its effect on the main signal is only 1 dB, then you can ignore it. In my measurement, there is one reflection at -15.5 dB, 2.22 ms from the Ref. This is 0.76 m. This is the additional distance that the sound has traveled from the source to the microphone, reflecting from something. Those. distance from source to microphone 2.58 m, 2.58 m + 0.76 m = 3.34 m. 3.34 m is the sum of the two sides of the triangle, the third side is 2.58 m. Why is the time from Ref to reflection peak related to the wavelength, which, after reflection, added with the direct wave and formed a peak?
 
Last edited:

John Mulcahy

REW Author
Joined
Apr 3, 2017
Messages
7,212
The extra time the reflection takes to arrive means its phase will be different to the phase of the direct sound. The difference in phase depends on the frequency, the shift in degrees is 360*time*freq. The most extreme examples of the effect of the phase shift are when it is a multiple of 180 degrees, odd multiples mean it will fully subtract from the direct sound, even multiples mean it will fully add.
 

sm52

Member
Thread Starter
Joined
Mar 14, 2019
Messages
863
I'm trying to comprehend the last message. And while I decided to ask a long-standing question. All 48 kHz impulse response measurements always have a tail at the end of the audio range. I measured at 96 kHz, limiting the oscillator frequency to 24 kHz. And this tail is not. Where could this surge come from?
 

Attachments

  • 48 + 96 kHz.PNG
    48 + 96 kHz.PNG
    126.5 KB · Views: 19

John Mulcahy

REW Author
Joined
Apr 3, 2017
Messages
7,212
Soundcard cal file, perhaps? 24 kHz is the end of the possible range for 48 kHz sampling so there is a sharp roll-off in the soundcard response just before.
 

sm52

Member
Thread Starter
Joined
Mar 14, 2019
Messages
863
Yes. And there is. This is because of the sound card calibration file. But why? It was created in REW using the sound card calibration file creation mechanism.
 

Attachments

  • SC Call.file.PNG
    SC Call.file.PNG
    77.2 KB · Views: 16

John Mulcahy

REW Author
Joined
Apr 3, 2017
Messages
7,212
Well, to state the obvious, the response of the soundcard as you have it configured for making your measurements is not the same as when you had it configured for calibration.
 

sm52

Member
Thread Starter
Joined
Mar 14, 2019
Messages
863
I made the settings for calibration the same as for measurements. Made a new calibration of the sound card. But the calibration schedule has remained much the same. At the edges of the range, the transition from the flat part to the falling part is slightly earlier. I am attaching two files. In the earlier one, a USB wire to the computer and a loopback wire were connected to the sound card. In the later, everything is connected to the sound card as in the measurement (+ amplifier, microphone). Somewhere up to 23 kHz everything is correct, then during calibration there is a sharp burst, which is not required during measurement.

I noticed such a thing. The calibration graph in the low frequency range is smooth. And at HF it smoothly reaches 22050 Hz, and then sharply down. It looks like the generator is turned on not at 48 kHz, but at 44.1 kHz. Therefore, it plays up to 22050 Hz. And further. During the sweep on the measurement window, I have Length = 1M, and the time for it is 5.5 s. And should be 21.8 s. And the sweep actually lasts 5.5 seconds. This is all during sound card calibration.
 

Attachments

  • Calibration file 21 nov 2020.mdat
    1.6 MB · Views: 8
  • Calibration file 24 june 2020.mdat
    1.6 MB · Views: 7
  • Length + Mes.Time.PNG
    Length + Mes.Time.PNG
    14.4 KB · Views: 10
Last edited:

John Mulcahy

REW Author
Joined
Apr 3, 2017
Messages
7,212
Sound card calibration uses its own sweep settings, not those set for measurements.

The calibration results do not cut off at 22050 Hz, they are only -3 dB at approx 22956 Hz.

37114


Something is different when you measure, otherwise there would not be a rise from the cal file. From your unsmoothed measurements the rise doesn't occur until 23.6 kHz, if you really care about the response above 23 kHz you should use a higher sampling rate.
 

sm52

Member
Thread Starter
Joined
Mar 14, 2019
Messages
863
I zoomed calibration graph horizontally. Around 22050 Hz there is a sharp change in the slope of the curve. This can be seen in your post as well. On the graph of the measurements not for calibration, but for the usual, yes, the tail lift is noticeable from 23.2 kHz. I wouldn't worry too much, but the tail makes all measurements look strange. This oddity concerns only the frequency response graph. The phase response graph does not take into account the sound card and microphone calibration files. So you wrote somewhere, it seems to me. For 44.1 kHz the picture is similar And for 96 kHz.
 

Attachments

  • SC Call.file 2.PNG
    SC Call.file 2.PNG
    73.1 KB · Views: 9
  • SC Call.file 3.PNG
    SC Call.file 3.PNG
    85 KB · Views: 10
  • SC Call.file 4.PNG
    SC Call.file 4.PNG
    99.8 KB · Views: 9
Last edited:

sm52

Member
Thread Starter
Joined
Mar 14, 2019
Messages
863
Made a sound card calibration file for 88.2 kHz and used it to measure at 48 kHz. The tail fell. It worked. But now it has become clear that the measurements have the same error. From 22 kHz the curve of the chart should last up to 24 kHz on the previous trajectory. But the graph began to fall down. This can be seen in the graph without the calibration file in post 91. Maybe the generator changes its behavior from 22 kHz because of the algorithm, or the sound card behaves like that.
Could you change the final frequency of the generator for verification? Instead of 24 kHz let him play up to 26 kHz. And for the graph to trim the data by 24 kHz.
 

John Mulcahy

REW Author
Joined
Apr 3, 2017
Messages
7,212
Could you change the final frequency of the generator for verification? Instead of 24 kHz let him play up to 26 kHz. And for the graph to trim the data by 24 kHz.
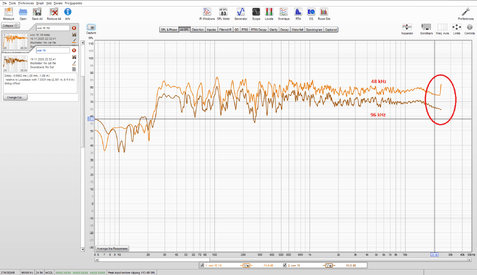
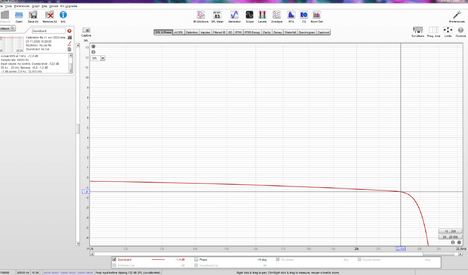
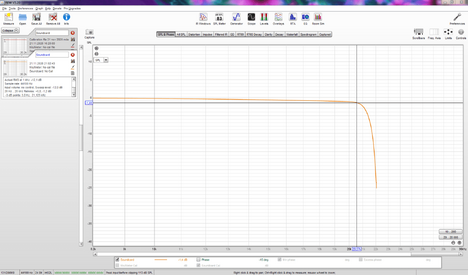
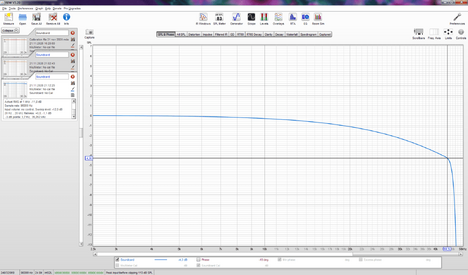
That is not how sampled data works. It is not possible to represent a frequency above 24 kHz with a 48 kHz sample rate. To avoid aliasing artefacts the system response must be as close to zero as possible at half the sample rate, ADC antialias filters and DAC reconstruction filters both have characteristics to try and achieve that. Google Shannon Sampling Theorem for more.
 

sm52

Member
Thread Starter
Joined
Mar 14, 2019
Messages
863
If the time from the peak of the test impulse to the peak of the reflection indicates the frequency of the wave at which the reflection appeared, amplifying the same decaying frequency from the test impulse, then I cannot explain how this is possible on the tweeter graph. A time of 0.00202 s gives a frequency of 495 Hz. But the tweeter no longer works at this frequency. On it, -50 dB is the noise level.
 

Attachments

  • tweeter.PNG
    tweeter.PNG
    165 KB · Views: 16
  • tweeter.mdat
    2.4 MB · Views: 7

jtalden

Senior Member
Joined
May 22, 2017
Messages
887
Location
Arizona, USA
More  
Preamp, Processor or Receiver
Marantz AV7705 Pre/Pro
Main Amp
VTV 6 chnl NC252MP P-amp x 2
Additional Amp
Behringer DCX2496 x 2
Universal / Blu-ray / CD Player
OPPO BDP-103 Universal Player
Front Speakers
DIY SEAS H1456/H1212 Spkr x 5
Subwoofers
DIY JBL 2235H 15" SW x 2
Video Display Device
JVC DLA-X790R
Screen
Da-Lite Da-Snap 39105V - 92"
Yes, but there is also the 2f, 3f, 4f, etc. frequencies that also reinforced. All these are reinforced by the mirrored speaker source of sound coming from the direction of the reflection. See the spectrogram below how this ~2.26 ms delayed line of sound is about 15 dB lower than the direct sound appears from 2-8 kHz (along the horizontal cursor). There is another similar reflection arriving at about 4.8 ms. This is all very typical in most common rooms.

37355
 

sm52

Member
Thread Starter
Joined
Mar 14, 2019
Messages
863
I'm trying to figure out how what John wrote in post # 86 works.
In the screenshot in my previous post, there is a reflection at 20.2ms. -20.3 dB. According to his explanation, this reflection is caused by a sound wave of 495 Hz. But this cannot be, because the tweeter at this frequency cannot generate a signal.
 
Top Bottom