Cristianolo
New Member
Hi all.
Is there some tutorial about the right way to measure passive components using REW?
Is there some tutorial about the right way to measure passive components using REW?


Follow along with the video below to see how to install our site as a web app on your home screen.
Note: This feature may not be available in some browsers.

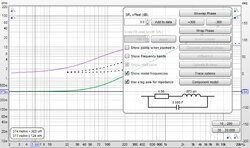
The impedance measurement function has actually been able to measure inductors and capacitors more accurately, at least in large frequency bands, especially the Rs of the inductor and the ESR of the capacitor can be displayed in the lower left corner.There isn't a single value for the resistive component of an inductor's impedance, it increases with frequency (principally due to skin effect). Even at lower frequencies the variation may be significant for large gauge wire. The values shown are the actual components of the impedance at the selected frequency, there isn't a question over their validity, only their accuracy, which reduces as impedance increases.


")

OK, you have collectively talked me into it


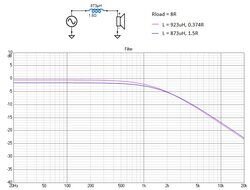
Thanks. I was rather limited in the range of inductors I had available to test with, but the fit is easily adapted to better manage larger values. If you can provide measurements of other large inductors that would be helpful.I have been trying out the component feature.


")
John wants to make REW become the reference software in electroacoustics and I think he is succeeding, my concern is that if it continues to increase its potential the day will come that I will no longer be able to use it with the Raspberry and I will no longer be able to assemble an audio analyzer all in one with open source hardware and software and I will necessarily have to use proprietary x86-based cpu hardware.
Anyway thanks John, superlative work !!
I agree entirely with your sentiment. I have not once used my CLIO pocket ever since I started to actively use REW. It's user friendly interface, flexibility and feature layout are just top notch. It already has bucket a load of feature capabilities and John keeps adding moreJohn wants to make REW become the reference software in electroacoustics and I think he is succeeding, my concern is that if it continues to increase its potential the day will come that I will no longer be able to use it with the Raspberry and I will no longer be able to assemble an audio analyzer all in one with open source hardware and software and I will necessarily have to use proprietary x86-based cpu hardware.
Anyway thanks John, superlative work !!
. I think what also gives it the edge is that John seems to have his ear on the ground about how users actually use his software and he adapts it accordingly, he support on issues raised is unparralled, even compared to paid-for software in my opinion. I cannot thank him enough.