Benoit Petit
Registered
Thread Starter
- Joined
- Aug 1, 2022
- Posts
- 8
Hello everyone!
I am a freelancer PA technician who used to work on tuning capture and Smaart but I heard about REW and found it really useful !
I try to improve the acoustical comportement of a venue in Belgium.
There are a huge simple echo (EDIT : not a flutter as written in the title) at some places into the venue (due to the architectural form) . The venue is a kind of a circle... and to be able to reach the last row with the PA, we have to overshoot a little bit.
It result as a huge echo for some people.
I have some solutions to solve it but I would like to measure properly the effect of my solutions.
it is were REW seems to be the right tool but... I am not able to measure what I want :
On the impulse section I clearly see the second big peak of energy coming from the wall. (the first one is the oposite side of the PA)
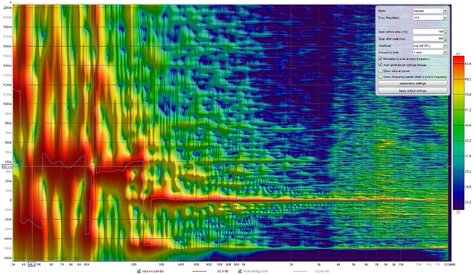
But in the waterfall or spectrogram section I can not see it... It seems that the window parameters does not affect the waterfall and spectrograph parameters...
Do you confirm that?
What I understand is that REW take the biggest peak as a start for the spectrogram and the waterfall. So I can only see the reflection (because the reflection is louder than the speaker).
Is that correct?
So, does anyone has a solution to visualize the first AND the second peak in the waterfall?
Thank you!

I am a freelancer PA technician who used to work on tuning capture and Smaart but I heard about REW and found it really useful !
I try to improve the acoustical comportement of a venue in Belgium.
There are a huge simple echo (EDIT : not a flutter as written in the title) at some places into the venue (due to the architectural form) . The venue is a kind of a circle... and to be able to reach the last row with the PA, we have to overshoot a little bit.
It result as a huge echo for some people.
I have some solutions to solve it but I would like to measure properly the effect of my solutions.
it is were REW seems to be the right tool but... I am not able to measure what I want :
On the impulse section I clearly see the second big peak of energy coming from the wall. (the first one is the oposite side of the PA)
But in the waterfall or spectrogram section I can not see it... It seems that the window parameters does not affect the waterfall and spectrograph parameters...
Do you confirm that?
What I understand is that REW take the biggest peak as a start for the spectrogram and the waterfall. So I can only see the reflection (because the reflection is louder than the speaker).
Is that correct?
So, does anyone has a solution to visualize the first AND the second peak in the waterfall?
Thank you!
Last edited: