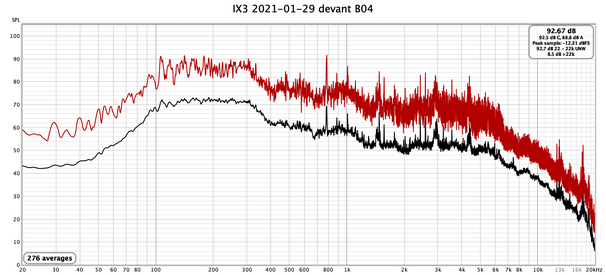
Hello everybody.
Disclaimers :
I searched a little on the forum but didn't find any clue, sorry if it's pretty obvious.
I'm totally new to REW and in fact pretty far away from audio stuff, unfortunately.
I want to make spectrum graphs from noise in Datacenter (in order to find the best noise protections).
A friend of mine who is very good at this stuff but very busy advised me to buy an Umik-1 (maybe because he's going to buy it back ) and to use REW to make spectrum graphs.
So I use this Umik-1 (with the 90° calibration file) and REW 5.20 on Mac OS 10.15
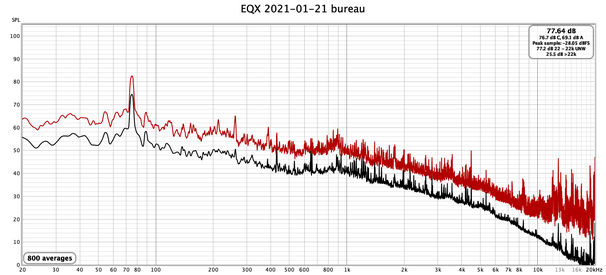
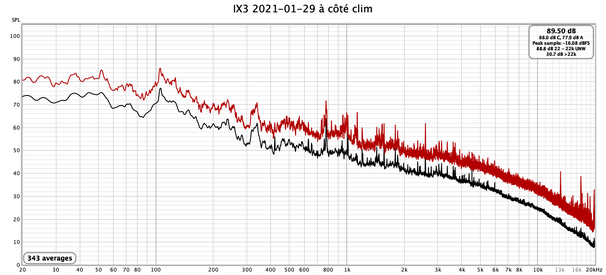
I have these two RTA graphs.
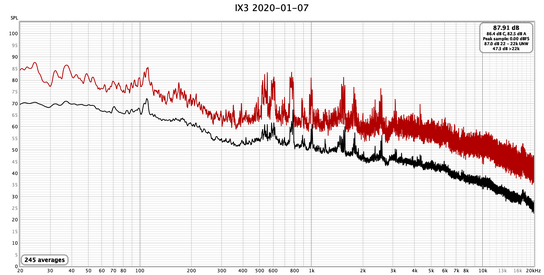
First graph, first room, the loudest (to the ear it's obvious).

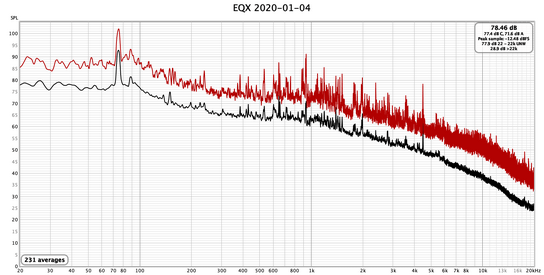
Second graph, second room, less noisy.

I set Forever averaging mode.
If I understand correctly, I have on average:
- for the first room (the loudest) 87.81 dB SPL
- for the second room (less noisy) 78.46 dB SPL
It corresponds perfectly to my feeling. But when I check the black lines, the less noisy room seems much more noisy that the loudest one, the line is always above).
By transparency:

What do I don't understand? (alas, a lot of things)
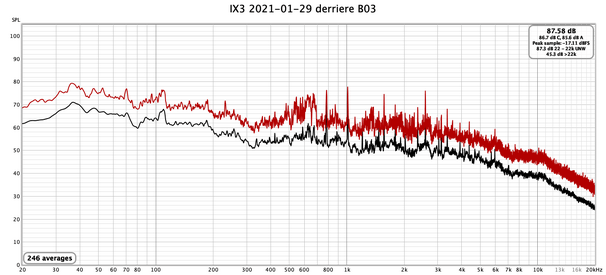
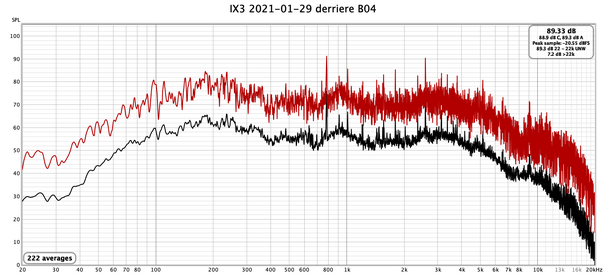
I have other spectra for these two rooms but it's always like that.
Does the peak sample at 0.00 dBFS mean that the input noise was to high for the Umik and has been clipped?
(it's maybe not appropriate to datacenters...)
Sorry for my clumsy english and thank you for your attention (and by making available free software).
Jeannot
Disclaimers :
I searched a little on the forum but didn't find any clue, sorry if it's pretty obvious.
I'm totally new to REW and in fact pretty far away from audio stuff, unfortunately.
I want to make spectrum graphs from noise in Datacenter (in order to find the best noise protections).
A friend of mine who is very good at this stuff but very busy advised me to buy an Umik-1 (maybe because he's going to buy it back
 ) and to use REW to make spectrum graphs.
So I use this Umik-1 (with the 90° calibration file) and REW 5.20 on Mac OS 10.15
I have these two RTA graphs.
First graph, first room, the loudest (to the ear it's obvious).
Second graph, second room, less noisy.
I set Forever averaging mode.
If I understand correctly, I have on average:
- for the first room (the loudest) 87.81 dB SPL
- for the second room (less noisy) 78.46 dB SPL
It corresponds perfectly to my feeling. But when I check the black lines, the less noisy room seems much more noisy that the loudest one, the line is always above).
By transparency:
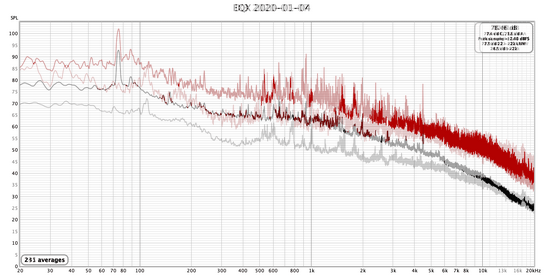
What do I don't understand? (alas, a lot of things)
I have other spectra for these two rooms but it's always like that.
Does the peak sample at 0.00 dBFS mean that the input noise was to high for the Umik and has been clipped?
(it's maybe not appropriate to datacenters...)
Sorry for my clumsy english and thank you for your attention (and by making available free software).
Jeannot


 )
)