John Mulcahy
REW Author
- Joined
- Apr 3, 2017
- Posts
- 9,393
Sure


Follow along with the video below to see how to install our site as a web app on your home screen.
Note: This feature may not be available in some browsers.

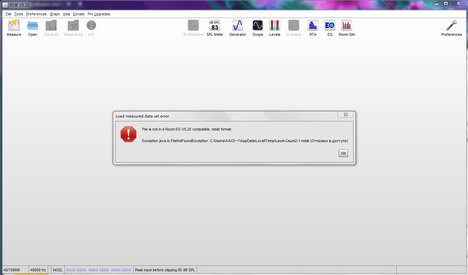
Meaning what?But REW couldn't count
Mr. Claus Futtrup has uploaded 6 videos about SpeakerBench.... This thread has some discussion of dual added mass that may be helpful and the Speakerbench site has some setup tips.
")