Phase and impulse info playing up.

mylesok

Registered
Thread Starter
Joined
Jun 9, 2020
Messages
1
Hey guys, I’m in a bit of a pickle with REW, hoping someone might know what’s going on.

For some reason the phase information for my measurements has gone whack. I have tried multiple speakers, multiple computers, multiple USB cables, different versions of REW, I even ordered a new Umik-1 because I thought the mic must have carked it, but I’m still getting the same thing. There must be some constant variable, but I just can’t figure it out. It seemed to start out of nowhere, one measurement was fine, the next was wrong.

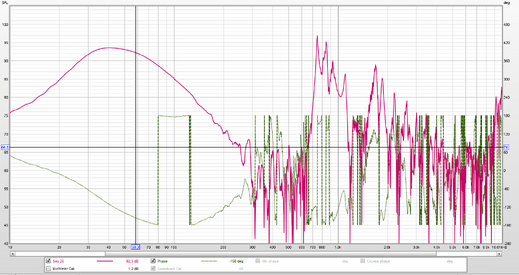
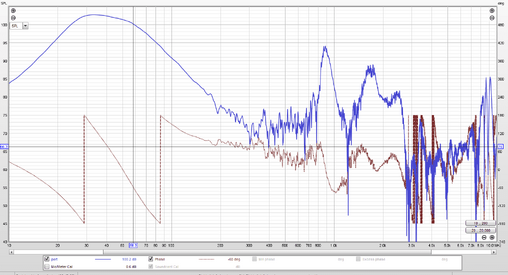
The images attached are the SPL and phase info of a near field port measurement before and after it started. Not the same speaker but you can clearly see difference in the phase plot.


Blue = before
Pink = after

Any suggestions are greatly appreciated as I can't make any progress as is.
Thank you!
 

Attachments

  • Bad phase.PNG
    Bad phase.PNG
    95.8 KB · Views: 24
  • Good Phase.PNG
    Good Phase.PNG
    67.7 KB · Views: 23

jtalden

Senior Member
Joined
May 22, 2017
Messages
887
Location
Arizona, USA
More  
Preamp, Processor or Receiver
Marantz AV7705 Pre/Pro
Main Amp
VTV 6 chnl NC252MP P-amp x 2
Additional Amp
Behringer DCX2496 x 2
Universal / Blu-ray / CD Player
OPPO BDP-103 Universal Player
Front Speakers
DIY SEAS H1456/H1212 Spkr x 5
Subwoofers
DIY JBL 2235H 15" SW x 2
Video Display Device
JVC DLA-X790R
Screen
Da-Lite Da-Snap 39105V - 92"
Both phase charts look normal. What looks bad to you with the first chart and why?

The phase rotation appears differently depending on where the impulse is located relative to t=0 on the impulse chart. You may want to experiment a little by moving the impulse location to understand the impact it makes.

Possibly the 'column' looking appearance around 100 Hz is bothering you? When the phase is wrapped between plus 180° and minus 180° as it is in your charts, the trace jumps vertically to the other limit when it falls outside the range. The vertical dashed lines are just to show where the phase wrap occurred and can be ignored. Optionally the phase wrap lines can be turned off in REW preferences/view if you prefer. See REW help for the SPL and phase chart for more info.
 

John Mulcahy

REW Author
Joined
Apr 3, 2017
Messages
7,212
What is your timing reference? Have you set a timing offset? Best posting mdat files for any further comment.
 
Last edited:

Adeptuz

Registered
Joined
Oct 16, 2020
Messages
11
Can I write one more question here? Can anyone explain the difference in impulse charts? These are different speakers under the same conditions. Perhaps the amplifier is not enough for xcelsus? Is this a negative phase?
midbass Morel tempo 6 and xcelsus xu6.2ci
xcVSm.jpg xcVSm2.jpg
 

Attachments

  • morel and xcelsus.mdat
    8.5 MB · Views: 9

sm52

Member
Joined
Mar 14, 2019
Messages
863
All 4 graphs have inverted polarity. Something in the measurement path is inverting the polarity. You can find the reason for this, or you can click the 'invert' button for each graph. High distortion after 1 kHz. You have no input and output devices selected. The sound card is internal. Windows can mix signals from different sources. These are possible things that can be fixed. But I did not see any significant differences between charts 1 and 2 or 3 and 4.
 

Adeptuz

Registered
Joined
Oct 16, 2020
Messages
11
All 4 graphs have inverted polarity. Something in the measurement path is inverting the polarity. You can find the reason for this, or you can click the 'invert' button for each graph. High distortion after 1 kHz. You have no input and output devices selected. The sound card is internal. Windows can mix signals from different sources. These are possible things that can be fixed. But I did not see any significant differences between charts 1 and 2 or 3 and 4.
1-2, 3-4 it is just 2 measures of same dynamics. Can you explain this "anomalies"?
1.png 2.png
 

sm52

Member
Joined
Mar 14, 2019
Messages
863
this "anomalies"
Have you corrected something I wrote? Any of these could be the cause of incorrect measurements. That is, I think that the speakers are not to blame, but the measurements themselves are incorrect.
 

jtalden

Senior Member
Joined
May 22, 2017
Messages
887
Location
Arizona, USA
More  
Preamp, Processor or Receiver
Marantz AV7705 Pre/Pro
Main Amp
VTV 6 chnl NC252MP P-amp x 2
Additional Amp
Behringer DCX2496 x 2
Universal / Blu-ray / CD Player
OPPO BDP-103 Universal Player
Front Speakers
DIY SEAS H1456/H1212 Spkr x 5
Subwoofers
DIY JBL 2235H 15" SW x 2
Video Display Device
JVC DLA-X790R
Screen
Da-Lite Da-Snap 39105V - 92"
In addition to the polarity issue mentioned above, I see that the Xcelsus has 2 tweeters side-by-side (per a quick look at their web page). This arrangement is highly likely to explain the very rough looking impulse response. It causes some comb filtering and results in more irregular high frequency SPL than a single tweeter would. I would also expect a lot of variability in measurement results when the mic position changes by even small amounts in any direction.

The phase chart goes down as a result of the interference between the tweeters (nulls in SPL), but this is a little misleading regarding the impact on the wavefront. Below are wavelet spectrograms of the 2 speakers showing the difference in peak energy arrival time. The 3 nulls at about; 3k, 4.2k and 6.3k Hz result in a small peak energy delay in across that frequency range.

The effect on perception of the sound quality is likely to be very small relative all the other more important listening environment influences.

Morel 1
45575


Xcelusus 1
45576
 

Adeptuz

Registered
Joined
Oct 16, 2020
Messages
11
All 4 graphs have inverted polarity. Something in the measurement path is inverting the polarity. You can find the reason for this, or you can click the 'invert' button for each graph. High distortion after 1 kHz. You have no input and output devices selected. The sound card is internal. Windows can mix signals from different sources. These are possible things that can be fixed. But I did not see any significant differences between charts 1 and 2 or 3 and 4.
New measurments, dayton imm-6, emu0204.
The phase chart goes down as a result of the interference between the tweeters (nulls in SPL), but this is a little misleading regarding the impact on the wavefront. Below are wavelet spectrograms of the 2 speakers showing the difference in peak energy arrival time. The 3 nulls at about; 3k, 4.2k and 6.3k Hz result in a small peak energy delay in across that frequency range.
Sorry 1-2, 3-4 it is measurments of one right door dynamic, without tweeter.
There is a new measurments of all 4 dynamics separately (closely to dynamics). And measurments from listening position (with DSP settings). Can you say something about it? Terrible result?)
1-L tw 3500hz bw24
2-R tw 4000hz bw24
3-L mbass 63hz bw24 and 3500hz bw24
4-R mbass 63hz bw24 and 2850hz bw24
 

Attachments

  • xc only 27sep2021.mdat
    7.9 MB · Views: 12
  • 23.mdat
    17.2 MB · Views: 9
Last edited:

sm52

Member
Joined
Mar 14, 2019
Messages
863
The measurement information is missing input and output device, input and output channel. If you do not select these devices, you measure all signals that windows mixes, and not just measurements from the microphone.
 

Attachments

  • no selected device 2.PNG
    no selected device 2.PNG
    35.4 KB · Views: 16
  • no selected device.PNG
    no selected device.PNG
    126.2 KB · Views: 14

Adeptuz

Registered
Joined
Oct 16, 2020
Messages
11
The measurement information is missing input and output device, input and output channel. If you do not select these devices, you measure all signals that windows mixes, and not just measurements from the microphone.
Does the external microphone connected to the sound card and built into the laptop measure at the same time? It can't be, the default one in these settings should work.
mic.jpg
And at the out there are no another sounds, only sweep from REW.
 

sm52

Member
Joined
Mar 14, 2019
Messages
863
Does the external microphone connected to the sound card and built into the laptop measure at the same time? It can't be,
Suggest to John, the author of REW, to exclude the input device, channel and output device and channel selection from the Preferences, Soundcard window. After all, everything can be done in the properties of sound ...
The Windows sound system is not designed for accurate measurements. An ASIO driver has been invented to disable the Windows mixer. And even if it is used during measurements, all devices must be turned off, except for the microphone and the output of the external sound card.
If you want accurate and clean measurements.
 
Top Bottom