wahoospiff
New Member
Thread Starter
- Joined
- Jan 15, 2018
- Posts
- 11
I have successfully created convolution filters in the past using REW and have recently purchased Audiolense (AL) to do the same (hopefully with improved results). My first attempt with AL seems to be pushing my speakers out of phase for some low frequencies leading to significantly lower bass SPLs. I am new to AL so am hoping that the community can review what I’ve done to see if my process or my conclusions are in error. Since this is a long post, I’ll try to summarize everything up front and then provide the details for those who wish to read on.
I started just with a 2 channel stereo setup (passive crossovers). My room is a large 23’x35’ somewhat L-shaped open floor plan space (not symmetric). I ran AL to create convolution filters and then evaluated the convolved results (implemented in ROON) using REW. I kept the microphone position unchanged throughout.
REW results from measuring each speaker separately show my AL corrections to the left and right channels moved the frequency vs SPL curve of each speaker closer to the target curve (a good sign). However, when I measured both speakers playing together with REW, I got some significant new dips (32-39 Hz, 55-62 Hz, and 79-104 Hz) which I could not understand because these regions were peaks in the uncorrected frequency response and did not look anomalous when examining just the left or right channels in AL or REW. The dips were also very audible – the bass had become very anemic because other dips were already present due to axial room modes that AL rightly does not eliminate.
I scoured past AL posts in the forums and came across one post where the user found that the corrections were causing phase shifts causing the speakers to be nearly out phase and thus producing dips in the SPL at certain frequencies. No resolution to this situation was posted and I only found this one post. I used REW to measure the phase of the left and right speakers separately and sure enough the speakers had shifted from being mostly in phase when no corrections were applied to being mostly out of phase when corrected using AL.
So my questions are:
-Did I run AL correctly?
-Do my measurements and conclusions using REW make sense?
-Is there anything I can do in AL to avoid the speakers moving out of phase?
I would expect more people to have reported this as an issue on these forums if this was a real or common issue but something is definitely reducing my bass response. My room is not dedicated to audio and thus there is little I can do with regards to bass trapping to try and reduce the DSP required. I spent a lot time trying to produce coherent color-coded plots to document my issue (details below). Any help greatly appreciated.
My room layout is shown is attached (room_layout.pdf). It is non-symmetric with a ceiling that varies in height from 8’ along the short walls to 11’ in the middle. A partial wall jets out more than halfway into the 23’x35’ space. It is not ideal and there is really only one corner in which I could put floor to ceiling bass trapping since it is not dedicated to audio. Speakers are conventional below 105 Hz and omni-directional above 105 Hz.
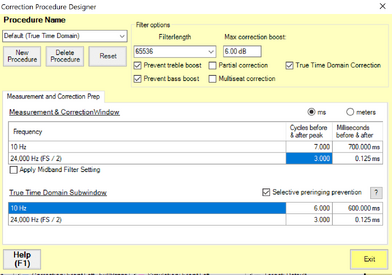
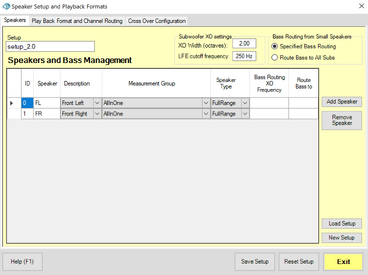
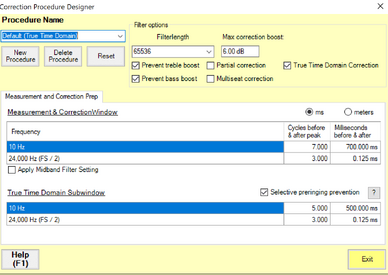
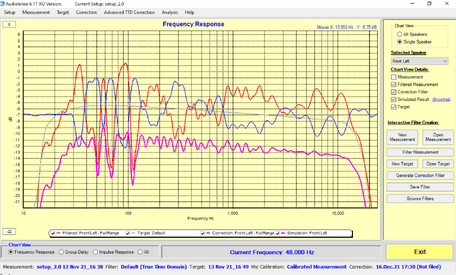
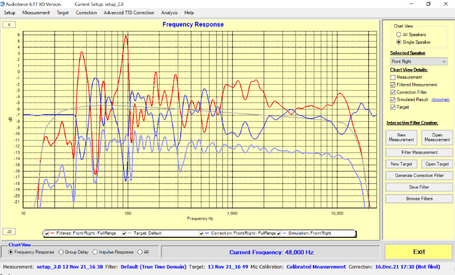
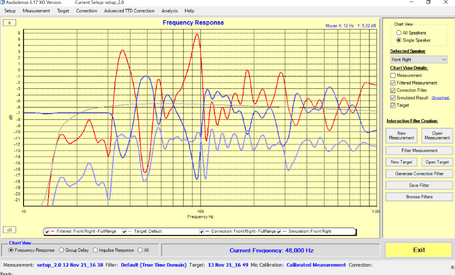
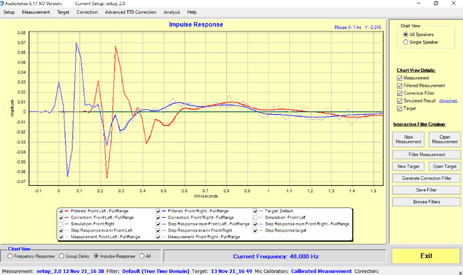
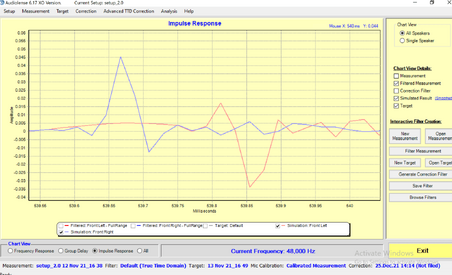
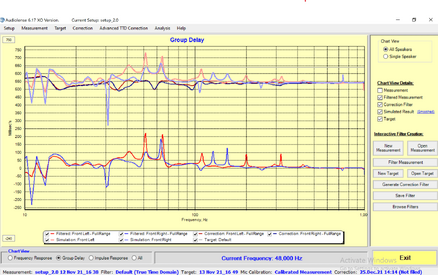
I’ve attached every AL screenshot I could think of (file names begin with “al_”). Target curve is fairly flat and one which I liked in the past when I used REW to generate filters. Note there are some big peaks and dips in the deep bass region (<100 Hz) for the uncorrected signal. This definitely is not an acoustically friendly room (my speakers are of high quality however). I have investigated axial room modes and have found differing modes for the left and right sides of the room. This seemed like a perfect application for DSP. I did play a bit with the frequency dependent windowing inputs but they didn’t seem to make a huge difference but my choices can surely be improved. The simulated impulse response plot (al_impulse_simulated.png) looks a little strange to me – any insight welcome.
I took the convolution filters created by AL and imported them to ROON. I then played a sine sweep file (created in REW) in ROON for two scenarios: 1) without any convolution filters and 2) with convolution filters created using AL. I measured the sine sweep for the two scenarios using REW as I have many times before. I exported the numerical results from REW to Excel so that I could create plots that aren’t available in REW (for example, to calculate phase difference between left and right channels).
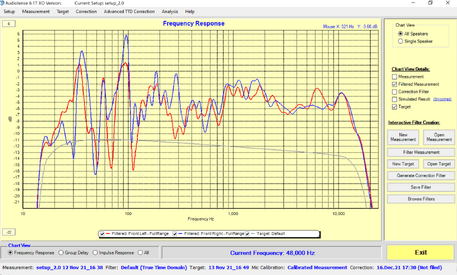
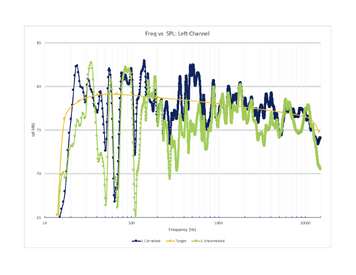
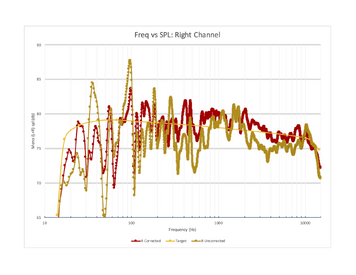
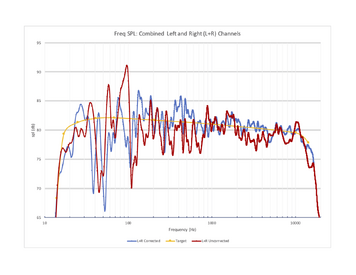
The REW based data are shown in the attached plots whose names all begin with “rew_”. Figures rew_L.pdf and rew_R.pdf show the measurements of frequency vs SPL for each speaker for no correction and with correction. I added the target curve as well to illustrate that the corrections do indeed move the uncorrected curve towards the target curve which seemed promising. I then measured both left and right speakers playing together (see rew_LR.pdf) and was a bit mystified (and also heard anemic bass response). The correction moves mid and high frequencies towards the target curve as expected but several peaks in the lower bass turned into dips.
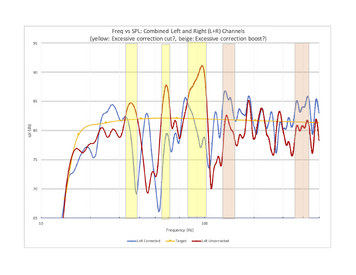
Figure rew_LR_500hz.pdf zooms in to show only frequencies from 10 to 500 Hz. The frequencies where peaks turned into dips are highlighted by the yellow background (32-39 Hz, 55-62 Hz, and 79-104 Hz). Two regions where the corrections seemed to excessively boost SPL (128-155 Hz, 354-441 Hz) are highlighted by the beige background for completeness but are not the main focus of my query since the SPL change after correction is not as great as in the yellow zones.
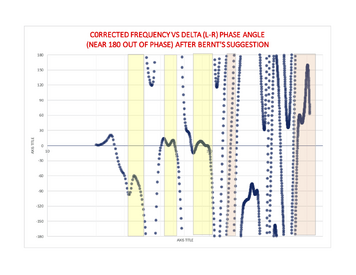
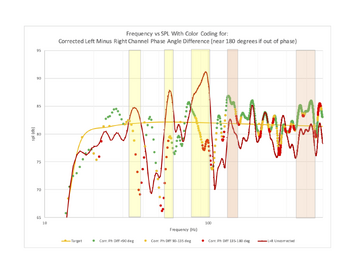
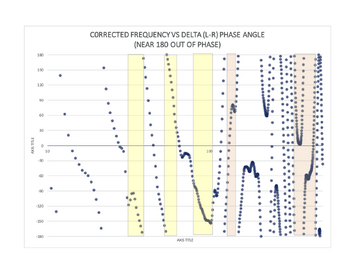
Using the raw REW data for each speaker measured separately, I computed the phase difference between the left and right speakers (at the listening position). I then spent way too much time in Excel creating a plot of frequency vs SPL color coded to show this delta phase angle (rew_LR_deltaPH.pdf). If the speakers were perfectly in phase, delta phase would be zero and if out of phase, delta phase would be 180 degrees. Data points for delta phase < 90 degrees were colored as green (i.e., cancellation not a concern), delta phase between 90 and 135 degrees were colored gold (i.e., cancellation somewhat concerning), and a delta phase more than 135 degrees were colored bright red (i.e., cancellation a concern). The color coding is only applied to the corrected signal, i.e., the uncorrected signal is shown by the solid dark red curve in the figure.
The yellow and beige regions in rew_LR_deltaPH.pdf are the same frequency ranges shown in the previous plots, i.e., the regions where the corrections seemed to be making changes I didn’t understand. The figure shows that for the yellow shaded regions where peaks were turned to dips by correction, the delta phase angle is high indicating the left and right speakers were nearly out of phase which one would expect to reduce the SPL.
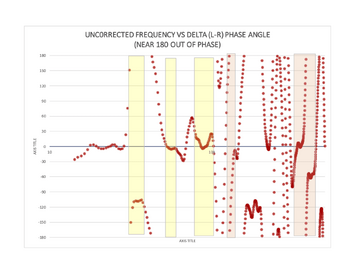
At this point I wondered whether the speakers might already have been nearly out of phase for these frequencies before correction was applied. Figures rew_LR_uncorr_deltaPH.pdf and rew_LR_corr_deltaPH.pdf show that the first yellow frequency region (32-39 Hz) was already somewhat out of phase before any correction was applied but that the two subsequent frequency regions (55-62 Hz, 79-104 Hz) were nearly in phase before correction and nearly out of phase after correction.
So if I haven’t screwed up, it seems correction is causing the speakers to be nearly out of phase causing noticeable dips from 55-62 Hz and 79-104 Hz which when combined with the rooms dips due to axial modes results in an undesirable bass response. Help appreciated!
John
SUMMARY
I started just with a 2 channel stereo setup (passive crossovers). My room is a large 23’x35’ somewhat L-shaped open floor plan space (not symmetric). I ran AL to create convolution filters and then evaluated the convolved results (implemented in ROON) using REW. I kept the microphone position unchanged throughout.
REW results from measuring each speaker separately show my AL corrections to the left and right channels moved the frequency vs SPL curve of each speaker closer to the target curve (a good sign). However, when I measured both speakers playing together with REW, I got some significant new dips (32-39 Hz, 55-62 Hz, and 79-104 Hz) which I could not understand because these regions were peaks in the uncorrected frequency response and did not look anomalous when examining just the left or right channels in AL or REW. The dips were also very audible – the bass had become very anemic because other dips were already present due to axial room modes that AL rightly does not eliminate.
I scoured past AL posts in the forums and came across one post where the user found that the corrections were causing phase shifts causing the speakers to be nearly out phase and thus producing dips in the SPL at certain frequencies. No resolution to this situation was posted and I only found this one post. I used REW to measure the phase of the left and right speakers separately and sure enough the speakers had shifted from being mostly in phase when no corrections were applied to being mostly out of phase when corrected using AL.
So my questions are:
-Did I run AL correctly?
-Do my measurements and conclusions using REW make sense?
-Is there anything I can do in AL to avoid the speakers moving out of phase?
I would expect more people to have reported this as an issue on these forums if this was a real or common issue but something is definitely reducing my bass response. My room is not dedicated to audio and thus there is little I can do with regards to bass trapping to try and reduce the DSP required. I spent a lot time trying to produce coherent color-coded plots to document my issue (details below). Any help greatly appreciated.
DETAILS
My room layout is shown is attached (room_layout.pdf). It is non-symmetric with a ceiling that varies in height from 8’ along the short walls to 11’ in the middle. A partial wall jets out more than halfway into the 23’x35’ space. It is not ideal and there is really only one corner in which I could put floor to ceiling bass trapping since it is not dedicated to audio. Speakers are conventional below 105 Hz and omni-directional above 105 Hz.
I’ve attached every AL screenshot I could think of (file names begin with “al_”). Target curve is fairly flat and one which I liked in the past when I used REW to generate filters. Note there are some big peaks and dips in the deep bass region (<100 Hz) for the uncorrected signal. This definitely is not an acoustically friendly room (my speakers are of high quality however). I have investigated axial room modes and have found differing modes for the left and right sides of the room. This seemed like a perfect application for DSP. I did play a bit with the frequency dependent windowing inputs but they didn’t seem to make a huge difference but my choices can surely be improved. The simulated impulse response plot (al_impulse_simulated.png) looks a little strange to me – any insight welcome.
I took the convolution filters created by AL and imported them to ROON. I then played a sine sweep file (created in REW) in ROON for two scenarios: 1) without any convolution filters and 2) with convolution filters created using AL. I measured the sine sweep for the two scenarios using REW as I have many times before. I exported the numerical results from REW to Excel so that I could create plots that aren’t available in REW (for example, to calculate phase difference between left and right channels).
The REW based data are shown in the attached plots whose names all begin with “rew_”. Figures rew_L.pdf and rew_R.pdf show the measurements of frequency vs SPL for each speaker for no correction and with correction. I added the target curve as well to illustrate that the corrections do indeed move the uncorrected curve towards the target curve which seemed promising. I then measured both left and right speakers playing together (see rew_LR.pdf) and was a bit mystified (and also heard anemic bass response). The correction moves mid and high frequencies towards the target curve as expected but several peaks in the lower bass turned into dips.
Figure rew_LR_500hz.pdf zooms in to show only frequencies from 10 to 500 Hz. The frequencies where peaks turned into dips are highlighted by the yellow background (32-39 Hz, 55-62 Hz, and 79-104 Hz). Two regions where the corrections seemed to excessively boost SPL (128-155 Hz, 354-441 Hz) are highlighted by the beige background for completeness but are not the main focus of my query since the SPL change after correction is not as great as in the yellow zones.
Using the raw REW data for each speaker measured separately, I computed the phase difference between the left and right speakers (at the listening position). I then spent way too much time in Excel creating a plot of frequency vs SPL color coded to show this delta phase angle (rew_LR_deltaPH.pdf). If the speakers were perfectly in phase, delta phase would be zero and if out of phase, delta phase would be 180 degrees. Data points for delta phase < 90 degrees were colored as green (i.e., cancellation not a concern), delta phase between 90 and 135 degrees were colored gold (i.e., cancellation somewhat concerning), and a delta phase more than 135 degrees were colored bright red (i.e., cancellation a concern). The color coding is only applied to the corrected signal, i.e., the uncorrected signal is shown by the solid dark red curve in the figure.
The yellow and beige regions in rew_LR_deltaPH.pdf are the same frequency ranges shown in the previous plots, i.e., the regions where the corrections seemed to be making changes I didn’t understand. The figure shows that for the yellow shaded regions where peaks were turned to dips by correction, the delta phase angle is high indicating the left and right speakers were nearly out of phase which one would expect to reduce the SPL.
At this point I wondered whether the speakers might already have been nearly out of phase for these frequencies before correction was applied. Figures rew_LR_uncorr_deltaPH.pdf and rew_LR_corr_deltaPH.pdf show that the first yellow frequency region (32-39 Hz) was already somewhat out of phase before any correction was applied but that the two subsequent frequency regions (55-62 Hz, 79-104 Hz) were nearly in phase before correction and nearly out of phase after correction.
So if I haven’t screwed up, it seems correction is causing the speakers to be nearly out of phase causing noticeable dips from 55-62 Hz and 79-104 Hz which when combined with the rooms dips due to axial modes results in an undesirable bass response. Help appreciated!
John
Attachments
-
 al_speaker_setup.png25.5 KB · Views: 99
 -
 al_correction_designer.png22.2 KB · Views: 101
 -
 al_LR_filtered_wtarget.png169.4 KB · Views: 113
 -
 al_L_all.png177 KB · Views: 101
 -
 al_R_all.png175.4 KB · Views: 104
 -
 al_L_below1000hz.png156.6 KB · Views: 103
 -
 al_R_below1000hz.png149.5 KB · Views: 107
 -
 al_impulse.png134.3 KB · Views: 111
 -
 al_impulse_simulated.png111.6 KB · Views: 112
 -
 al_group_delay.png146.8 KB · Views: 115
 -
 rew_L.png111.8 KB · Views: 109
 -
 rew_R.png107.3 KB · Views: 103
 -
 rew_LR.png87.6 KB · Views: 101
 -
 rew_LR_500hz.png79.8 KB · Views: 104
 -
 rew_LR_deltaPH.png85.4 KB · Views: 100
 -
 rew_LR_uncorr_deltaPH.png77 KB · Views: 97
 -
 rew_LR_corr_deltaPH.png83.5 KB · Views: 94