REW Beta Release New requested features in REW, upgrade level meter.

Thread Starter
Joined
Feb 8, 2018
Messages
279
Location
Italy
Hello, it would be interesting to add to the Levels tool the possibility of carrying out measurements not only in dbfs but also in Volt dbv dbu W, exploiting the calibrations made in output within the Generator tool and in input with RTA.
By doing so we could have a real level meter.
Thank you
 

John Mulcahy

REW Author
Joined
Apr 3, 2017
Messages
7,311
Good idea, I'll add it to the list. The bars would continue to show dBFS but I could add numeric indicators of the rms level in the selected units.
 
Thread Starter
Joined
Feb 8, 2018
Messages
279
Location
Italy
A fantastic job has been done on REW's latest RC7 release. The level meter works really very well, to test it I send two photos on the level measured at the output to the power amplifier with a true Rms voltmeter of the HP indicating 2.84Vrms and the level measured by REW after having performed the calibration on the generator and on the level measured in input by the RTA function. As you can see both the generator and the level meter that RTA measure the same voltage level.

Fantastic
Thanks so much John
 

Attachments

  • hp8920A_2840mV.jpg
    hp8920A_2840mV.jpg
    186.7 KB · Views: 44
  • Calibrazione del livello 2021-04-09 17-56-01.png
    Calibrazione del livello 2021-04-09 17-56-01.png
    167.3 KB · Views: 50

oliver

New Member
Joined
May 24, 2017
Messages
108
Location
Italy
Hi John,
would be also great if the input numeric label units could be independently selected on the two inputs so as to show for example an SPL value on channel 1(usually used for the microphone) and a voltage value for channel 2(usually a loopback).
Thank you,
Oliver.
 
Thread Starter
Joined
Feb 8, 2018
Messages
279
Location
Italy
Hi Oliver,
I would say that for the channel you use for the loopback it is not essential to measure in volts as it just needs to be inside the green area of the level meter as it only serves as a time reference and then remains at a constant level.
However, you can make a quick switch in volts to check and then return to SPL.

Greetings
Antonio
 

oliver

New Member
Joined
May 24, 2017
Messages
108
Location
Italy
Hi Antonio,
you are right, but I do deal with earphones and different measurements scenario. My measurement rig is made of different audio interfaces from 2 In/out to multiple In/out like the RME UC audio interface and I do switch frequently from impedance to SPL measurements and also I switch between different software. Sometimes I. do need to move the input controls and recalibrate the software, so having the correct label unit indicator for the two channels depending on what is connected to the input would be a nice feature in my opinion.

Saluti e buona domenica.
Oliver
 
Thread Starter
Joined
Feb 8, 2018
Messages
279
Location
Italy
I have carried out other tests on the level of the measured signal and actually the measurements have a good accuracy from the maximum level of the output signal to the power amplifier equal to 8.9 Vrms to the minimum signal of about 10mVrms below this minimum level is affected by noise.
But it is precisely on the noise level I have some doubts, in fact by turning off the generator the RTA shows a much lower noise level than that measured by the FLUKE 8920A and the Picoscope.
The noise measurement is 28mVrms with the Fluke and Picoscope while REW measures three different values, the level meter displays 2.35mV the noise in the 430uV distortion box and the level measured by RTA 951uV.
The noise level measured by RTA should be reported to the highest peak at 47-48Khz the noise level of the distortion box should be much higher because it includes the noise generated on the entire audio band, instead it is only 430uV. The only higher value is that of the level meter but we are well below the 28mV around -20db.

Maybe I'm missing something?

Thank you
Rumore di Fondo in Volt Schermata del 2021-04-11 11-17-03.png
 

John Mulcahy

REW Author
Joined
Apr 3, 2017
Messages
7,311
The N (noise and non-harmonic distortion) figure in the distortion box is for the span to 45.6 kHz, as shown in the box. Distortion data ignores content above 95% of the Nyquist limit to exclude artefacts around Nyquist even if the distortion LP is not selected. The RTA levels panel uses the same upper limit as the distortion panel, which arguably it shouldn't if the distortion LP is not selected. Both exclude DC.

The levels meter is showing the rms value of blocks of audio samples, for a 96 kHz sample rate those blocks are 16k samples long.
 

John Mulcahy

REW Author
Joined
Apr 3, 2017
Messages
7,311
The higher values on Fluke and picoScope are probably due to content above 48 kHz.
 
Thread Starter
Joined
Feb 8, 2018
Messages
279
Location
Italy
Good morning,

I had thought that the noise generated by the system had contributions higher than 48Khz in fact I selected the 40Khz filter on the Picoscope 4262 and the noise actually reduced but in any case if I remember correctly it is about 8mV.
As soon as possible I repeat the measurement and let you know precisely.

Thank you
 
Thread Starter
Joined
Feb 8, 2018
Messages
279
Location
Italy
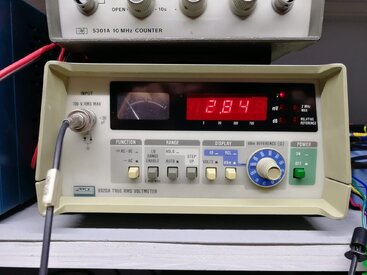
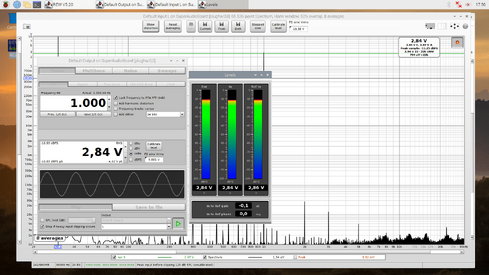
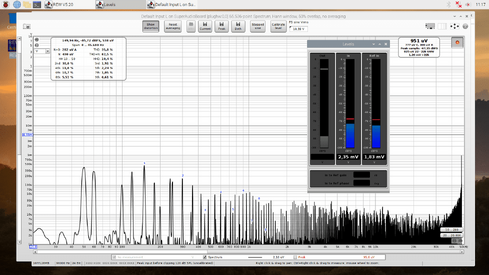
I did further tests to check the noise level measured by the system. I confirm that the lower level measured by REW compared to the Fluke 8920 and the Picoscope are due to the bandwidth that with the sound card is limited to less than 48Khz while for measuring instruments they do not have this limit.
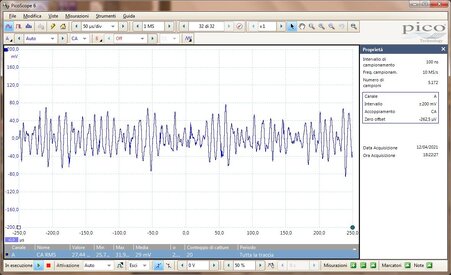
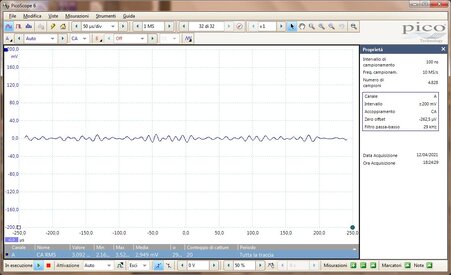
I set the Picoscope oscilloscope's input filter to 40Khz and actually the noise drops to about 8mV, even higher than that indicated by the REW level meter.
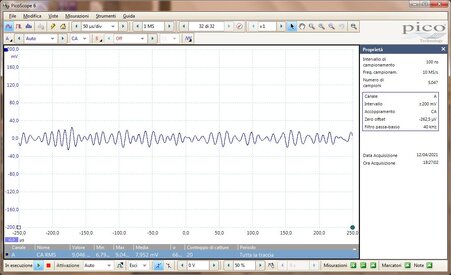
But not happy, I measured the actual cutoff frequency of the oscilloscope and I found a frequency of 55Khz, so I verified that the actual Cutoff frequency at 40Khz corresponded to the picoscope setting at 29Khz.
I took the measurements again and this time the noise level of the picoscope decreased to 2.9mV very close to the noise measured by REW.
I confirm that the REW noise measurement is in line with that measured by Fluke and Picoscope taking into account the audio band limit to comply with the Nyquist sampling theorem.
Unfortunately, I trusted the accuracy of the Picoscope filter and instead the wrong cutoff frequency distorted the measurement.

Sorry if I bored you and thanks for your attention

Greetings
Antonio
 

Attachments

  • Noise_no_filter.jpg
    Noise_no_filter.jpg
    134.2 KB · Views: 15
  • Noise_filter_40Khz_error_picoscope_55Khz.jpg
    Noise_filter_40Khz_error_picoscope_55Khz.jpg
    119.1 KB · Views: 17
  • Noise_filter_40Khz_real.jpg
    Noise_filter_40Khz_real.jpg
    112.1 KB · Views: 17
  • Rumore di Fondo in Volt Schermata del 2021-04-11 11-17-03.png
    Rumore di Fondo in Volt Schermata del 2021-04-11 11-17-03.png
    174.2 KB · Views: 16

John Mulcahy

REW Author
Joined
Apr 3, 2017
Messages
7,311
No problem, thanks for the detailed follow-up. I have changed the way the main RTA level figure is calculated when the distortion LP is not in use so that it includes the full bandwidth and should read the same as the Levels meter.
 
Top Bottom