Antonio Di Motta
Member
Ok, let me know how the project is progressing and the results you get.
Each experience is very interesting.
Greetings
Each experience is very interesting.
Greetings


Follow along with the video below to see how to install our site as a web app on your home screen.
Note: This feature may not be available in some browsers.

please see attached FR and NSOk, let me know how the project is progressing and the results you get.
Each experience is very interesting.
Greetings
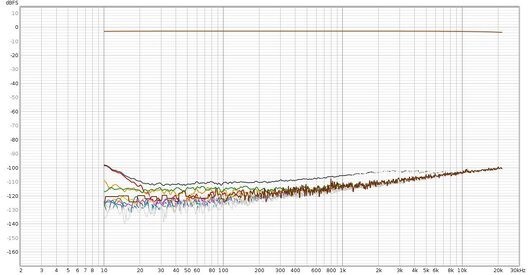
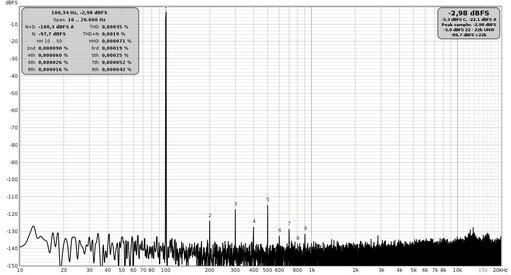
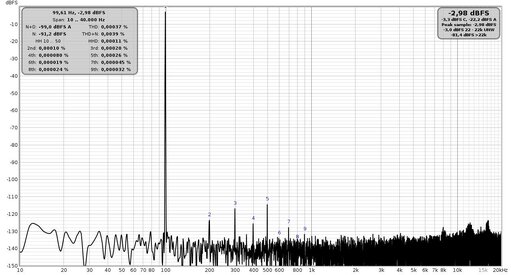
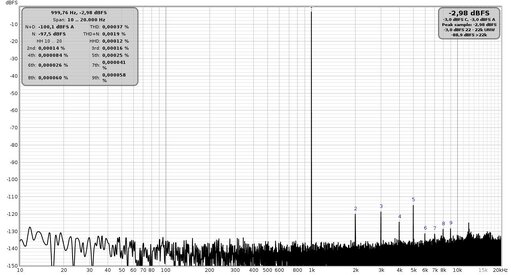
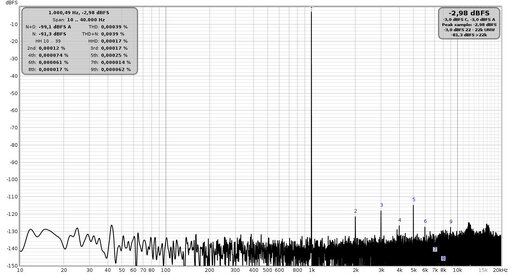
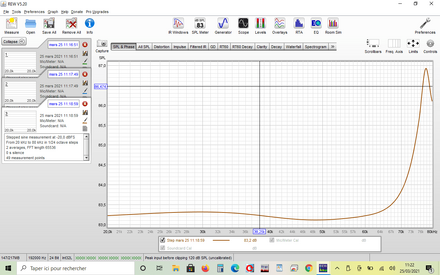
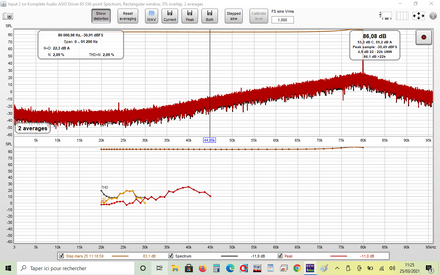
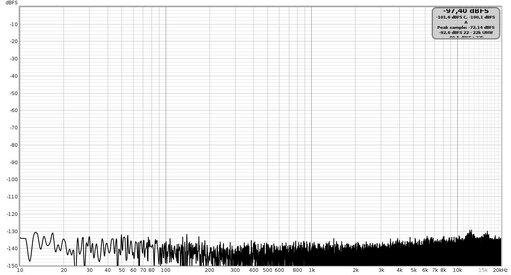
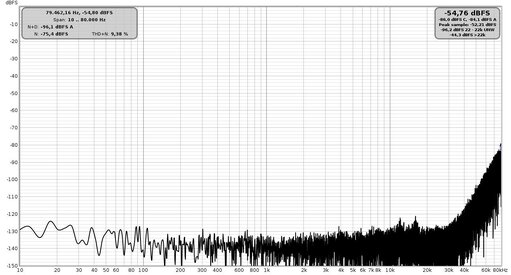
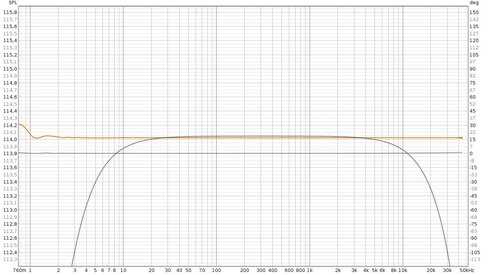
Why would I need a corrective curve when the response is flat to 92kHz, without filter?I hope you have calibrated the sound card first and only then plotted the overall response curve including the calibration corrective curve.
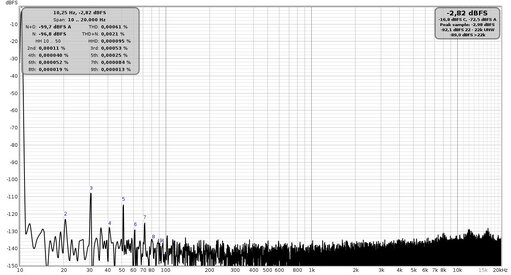
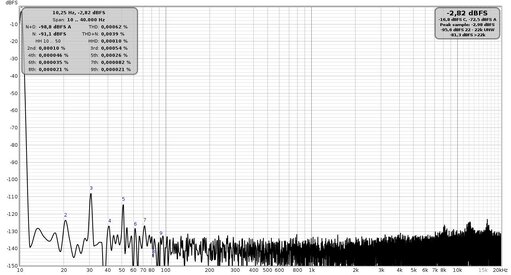
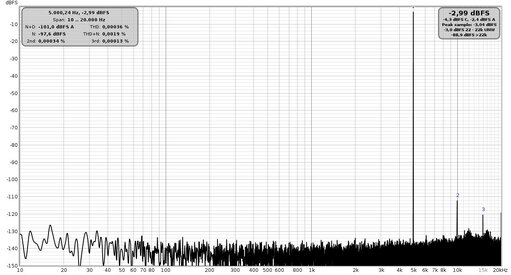
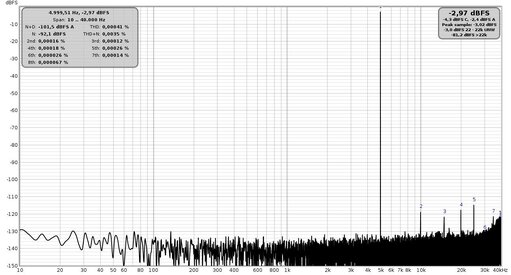
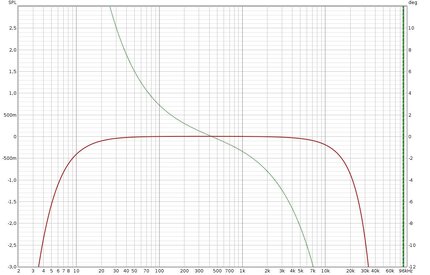
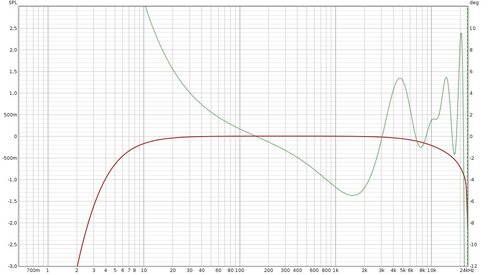
This graph shows exactly how much error is produced by the filter. If I had compensated it, I wouldn't have seen this "anomalous" peak. In order to try to fix it, I need to see the uncompensated graph.I would have expected a loop out / in sound card calibration curve like this one I'm attaching to you which is actually my 192Khz sound card.
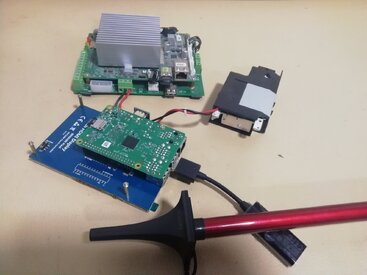
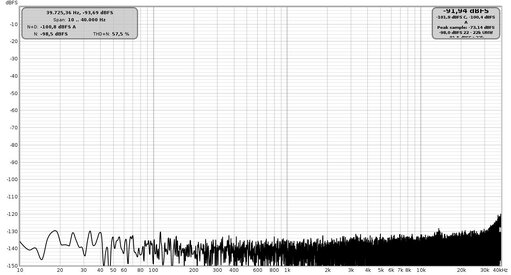
Consider that my band is currently limited by the output filter to the DAC at about 40Khz, since at the moment I do not need to verify beyond this frequency.
Once the calibration is done, the response measurement must be perfectly compensated in the selected frequency range and you should not have that peak at 80Khz which is quite anomalous.
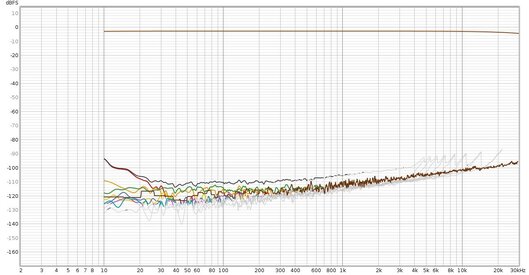
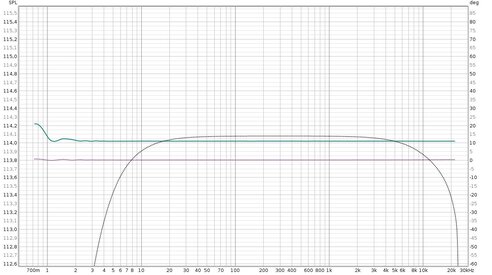
You don't understand what I did. I calibrated the system in loopback, that shows a flat line up to about 90kHz.If you want to be sure of what you are measuring I advise you to always calibrate the sound card, this is my way of operating.
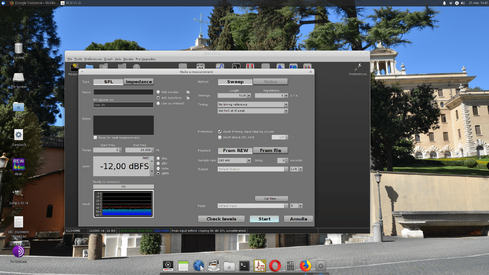
Indeed to say that there are more than one calibration, there is the one relating to the response, the one relating to the impedance, the calibration of the generator levels and the RTA level and also the microphone calibration file.
All these calibrations serve to give reliable indications to REW which behaves as and even better a measuring instrument.
In fact, even the measuring instruments must be calibrated.
There was a bad interpretation, I was talking about compensation of the sound card, not compensation with the inserted filter.This graph shows exactly how much error is produced by the filter. If I had compensated it, I wouldn't have seen this "anomalous" peak. In order to try to fix it, I need to see the uncompensated graph.

The end frequencies are at one-third octave centres, 80 kHz is the last one-third octave centre frequency that is less than 96 kHz (the next is at 100 kHz).Try as I might, I couldn't enter more than 80kHz in the stepped sine mask.