Hi @John Mulcahy
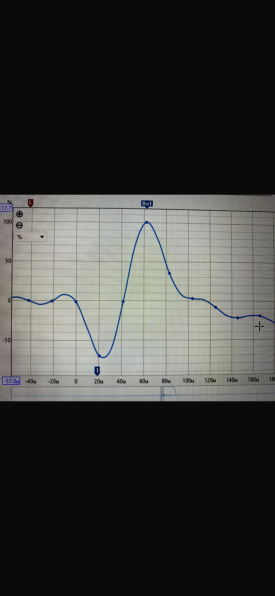
Can you help me with what this "T" is? See screenshot below.

I asked Grok but doesn't seem correct?
Blue T icon is not the t=0 mark. I can shift t=0 to anywhere, IR start, IR peak, even t=cursor. None of these move the T icon. Also the T icon does not align with t=0 when t is reset.
The T appears fixed wrt the impulse once measured, but its position wrt the impulse is different for each measurement (ie its not a generic position) - although if I simply repeat a measurement the T / IR relationship is the same.

Can you help me with what this "T" is? See screenshot below.

I asked Grok but doesn't seem correct?
Blue T icon is not the t=0 mark. I can shift t=0 to anywhere, IR start, IR peak, even t=cursor. None of these move the T icon. Also the T icon does not align with t=0 when t is reset.
The T appears fixed wrt the impulse once measured, but its position wrt the impulse is different for each measurement (ie its not a generic position) - although if I simply repeat a measurement the T / IR relationship is the same.


