Help wanted in integrating sub using delay

Jochie

New Member
Thread Starter
Joined
Jan 6, 2026
Posts
10
More  
Preamp, Processor or Receiver
Minidsp Flex Balanced w/ Dirac Live
Main Amp
Apollon Purifi 1ET7040SA ST
Computer Audio
Spotify / Tidal
Streaming Equipment
PC
Front Speakers
Dali Opticon 6
Subwoofers
SVS PB2000
Headphones/IEMs
HD650
Headphone DAC/Amp
Topping D30 pro / A30 pro
Hello everyone,

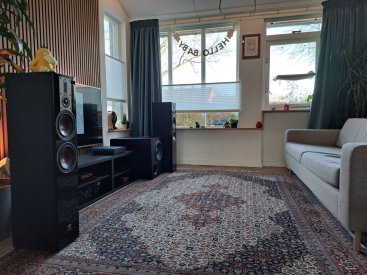
New member here. The listening part of my room is: 380cm (150inch) (front to back) cm x 350cm (138inch) (side to open floor plan, towards my back when pic was taken). Gear: pc>minidsp flex> svs pb2000 Lowpass 80Hz BW24/dB and Apollon ET7040>Dali Opticon 6 Highpass 80Hz BW24/dB.

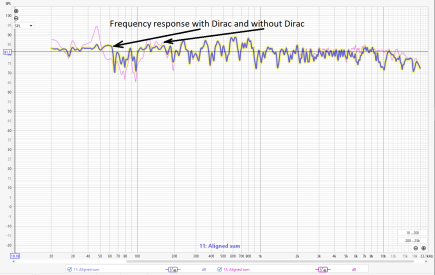
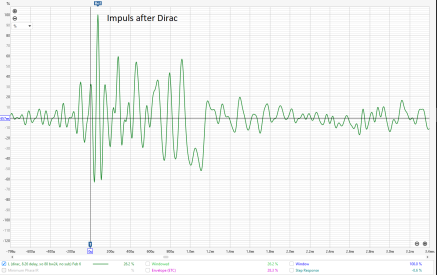
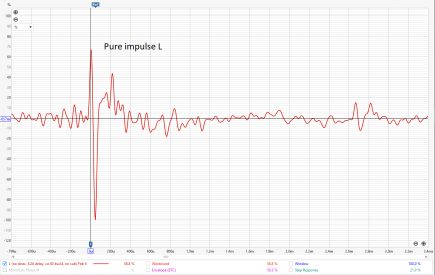
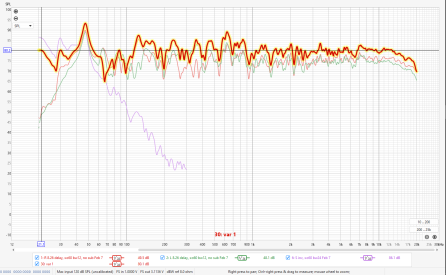
After some help on ASR I tried to integrate my sub as well as possible. I applied these settings: mains 17.6ms delay, sub inverted, subgain -10 to taste, and it sounds really coherent. I just uploaded the measurements of both before (L+R, sub, L+R+sub) and after (L+R+sub with the settings applied). To my eyes, the graph with the delay and inverted sub looks a bit worse with a bigger dip at 55Hz and a slight dip around 100Hz? Could somebody be so kind as to fiddle with these measurements and for example the time alignment tool to see if this is the "best" result, or if there is room to improve?
 

Attachments

  • Sub integration attempt.mdat
    Sub integration attempt.mdat
    2.2 MB · Views: 15
  • WhatsApp Image 2025-12-28 at 12.54.03 (1).jpeg
    WhatsApp Image 2025-12-28 at 12.54.03 (1).jpeg
    412.1 KB · Views: 22
Last edited:
Hello. I tried using measurements 1 and 2 to get a good total. Try delaying L+R by 8.26 ms, invert the sub (relative to measurement 2), and add +6 dB to it. I expanded the names of the measurements to make it clear what has changed in them. Addition of sub and L+R in the 8th measurement.
L+R drops off from 80 Hz. The sub seems to drop from 60 Hz (looking at graph 2). A hole from 55 Hz and above is most likely due to the room, but may be due to the subwoofer filter being too early.
 

Attachments

Hello. I tried using measurements 1 and 2 to get a good total. Try delaying L+R by 8.26 ms, invert the sub (relative to measurement 2), and add +6 dB to it. I expanded the names of the measurements to make it clear what has changed in them. Addition of sub and L+R in the 8th measurement.
L+R drops off from 80 Hz. The sub seems to drop from 60 Hz (looking at graph 2). A hole from 55 Hz and above is most likely due to the room, but may be due to the subwoofer filter being too early.
Ow wow, thank you so much. I applied the settings and listening now - sounds really good so far. Should I take a measurement of the applied settings and upload?
 
If you want more, take measurements separately for the right side (reference is also right), separately for the left (reference is right), separately for the sub (reference is right). After that, show (upload). To try to reduce the hole after 50 hertz, you can change the slope of the subwoofer filter. Now it is 18 dB/oct, frequency 50-60 hertz. Make 12 dB/oct at the same frequency. Or 24 dB/oct at 70-80 hertz. You can also reduce the cutoff frequency of the main ones, 70-60 hertz, the slope is the same as now, 14 dB/oct. I wrote real slopes, although you see others on the equipment.
 
Hi @sm52, thank you so much. I haven't changed the slopes just yet, because in the Minidsp software it is set to 24 dB/oct Butterworth at 80Hz. There is a difference between real slopes and the ones in the software? Sorry, I am not very knowledgeable in this subject. I uploaded the new measurements like you said

If you want, let me know if you see yet room for improvement or if I'm all set now. I appreciate you for taking the time and effort to help me out.
Ps. I also made a Dirac filter with the current settings, should I upload the rew measurements with that in place or is that not important?
 

Attachments

Last edited:
Here is with Dirac. And so far, with Dirac (up to 250Hz) it sounds really incredible. But I just listened to it for a short while, I need some more time to give a proper reaction.
 

Attachments

Last edited:
Dirac leveled the overall frequency response. Looks beautiful. But to do this, he distorted the impulses so that it was impossible to look at them “without tears.” This means that you are not listening to the original, recorded signal, but a distorted one, something that is not in the recording. Without Dirac, a large hole is obtained from 52 hertz to 115 hertz, but the impulses are clean. You listen to what is recorded, but without the 52-115 hertz range. I see the solution here. Do not use Dirac. Change filter frequencies and their slopes to reduce the 52-115 Hz pit as much as possible. That's what I would do. But you're listening, so it's up to you.
"There is a difference between real slopes and the ones in the software?"
Yes.
 

Attachments

  • Frequency response with Dirac and without Dirac.PNG
    Frequency response with Dirac and without Dirac.PNG
    149.5 KB · Views: 18
  • Impuls after Dirac.PNG
    Impuls after Dirac.PNG
    140.5 KB · Views: 15
  • Pure impulse.PNG
    Pure impulse.PNG
    97.8 KB · Views: 14
OK, as little as I know of reading impuls charts, the pure one looks way better. It feels good to have the timing figured out, now for fine tuning the slopes. So if I get this straight: I apply different slope settings like you suggested, and measure the result as follows: ("L" - "R" - "S") for each setting, and then looking in All SPL to which group of 3 gets the higher response between 52-115 hertz.
 
Last edited:
We are interested in several crossover frequencies and two slopes. Frequencies 60, 70, 100, 110. Slopes 12 dB/oct. And 24 dB/oct. Total 8 sets of three measurements, L, R, Sub. Dirac off.
 
Alright, here are the results. It's a lot for me to unpack with so many measurements, looking forward to your analysis on this. To me, it looks like highpass 70Hz has pretty good results in the 50Hz region? But I'm mostly guessing tbh.
 

Attachments

Last edited:
I can look at it this evening. So be patient.
Try to make L and R XO 24 dB/oct 70 Hz. Sub XO 24 dB/oct 60 Hz -5 dB. This is preliminary.
 
Last edited:
Dirac leveled the overall frequency response. Looks beautiful. But to do this, he distorted the impulses so that it was impossible to look at them “without tears.” This means that you are not listening to the original, recorded signal, but a distorted one, something that is not in the recording. Without Dirac, a large hole is obtained from 52 hertz to 115 hertz, but the impulses are clean. You listen to what is recorded, but without the 52-115 hertz range. I see the solution here. Do not use Dirac. Change filter frequencies and their slopes to reduce the 52-115 Hz pit as much as possible. That's what I would do. But you're listening, so it's up to you.
"There is a difference between real slopes and the ones in the software?"
Yes.
I don’t believe the after Dirac impulse is normal expected results at all. If I got those results I would reach out to Dirac to ask them to take a look at the project file. I’d also take a look at the impulse response results within the Dirac software, just for a sanity check.

Also what’s going on before the main impulses here? Does that look right? Maybe it’s fine and I’ve just not seen it before.
 
I don’t believe the after Dirac impulse is normal expected results at all. If I got those results I would reach out to Dirac to ask them to take a look at the project file. I’d also take a look at the impulse response results within the Dirac software, just for a sanity check.
The measurements were taken normally. What has become of the impuls is normal for the goal that Dirac achieves. It distorts the original signal in such a way as to obtain a flat frequency response. But whether the listener will hear what was recorded, what the musicians and sound engineers wanted to convey to the listener, is a question.
 
The measurements were taken normally. What has become of the impuls is normal for the goal that Dirac achieves. It distorts the original signal in such a way as to obtain a flat frequency response. But whether the listener will hear what was recorded, what the musicians and sound engineers wanted to convey to the listener, is a question.
I understand what you’re saying about these results, but what I’m saying is the results don’t appear to be normal Dirac behavior and I would at least ask Dirac about it. In my experience with Dirac and checking corrections with REW and also looking at other’s measurements, Dirac has always cleaned up the impulse response and not made it far worse as in this example.
Dirac even advertises impulse response correction. See this page:
 
The final version is as follows. Sub 60 Hz 24 dB/oct -6 dB. L and R 60 Hz 12 dB/oct delay + 2 ms (8.26 ms + 2 ms = 10.26 ms). You can try a delay for L and R of 10.76 ms, or 11.26 ms. You can sub not -6 dB, but -5 dB. After all, you need to make a peak filter at 47 Hz - 8-10 dB to remove the standing wave.
 
Last edited:
The final version is as follows. Sub 60 Hz 24 dB/oct -6 dB. L and R 60 Hz 12 dB/oct delay + 2 ms (8.26 ms + 2 ms = 10.26 ms). You can try a delay for L and R of 10.76 ms, or 11.26 ms. You can sub not -6 dB, but -5 dB. After all, you need to make a peak filter at 47 Hz - 8-10 dB to remove the standing wave.
Thank you yet again! During the measurements, the sub was in Minidsp at -7dB. Does that mean I should turn it down 6 or 7 dB again, so around -13 of -14dB? And keep it inverted?

And would you suggest to make the peak filter using REWs EQ function? Or just manually add it in Minidsp software like just that?
1770583450540.png
 
Yes, the subwoofer level needs to be lowered relative to the measurements from post #10 by 6 dB. It should look like the picture. One peak filter can be made in miniDSP.
It may seem like there is not enough bass. But if you raise the subwoofer level, a pit will appear from 55 to 115 hertz. So the last variant looks almost good.
Your listening location is approximately 11 square meters. But it seems that the whole room is big. Now the sub is located near the right speaker. It's almost in the corner. Have you tried placing the sub near the left speaker?
 

Attachments

  • var1 6sub+1R+2L .PNG
    var1 6sub+1R+2L .PNG
    230.2 KB · Views: 16
Last edited:
You're right, to the left side of this picture is a open floor plan with dining and kitchen area. Sub to the left may be possible, if not troublesome. There is a tiny wall there, I placed some GIK bass traps there. Right now it sounds very good. I think I'll keep it as is for a while, and enjoy the way it sounds now.

I will also make a measurement to see how it compares to your model.

WhatsApp Image 2025-12-28 at 12.54.04.jpeg
 
Back
Top