FR worsens with EQ

wus

Member
Thread Starter
Joined
Dec 23, 2020
Posts
55
More  
Preamp, Processor or Receiver
Windows 10 PC
Computer Audio
1: ESI Maya22USB and an iSEMcon EMX-7150 microphone for measurements; 2: LogiLink UA0099 USB Sound Card for music output;
Front Speakers
2 x JBL 305P MkII
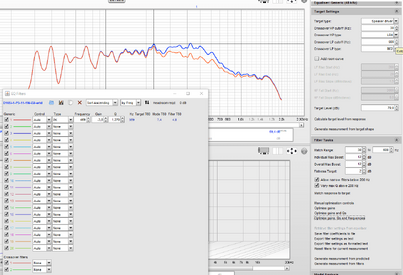
I'm using REW 5.20.13 to measure the in-room frequeny responses of a woofer, at 9 different listening positions in the room. To get a base for REW's EQ to work off, I then first SPL-aligned the 9 curves (as recommended in the manual) and then db averaged it with REW's controls. Next I used the resulting average FR to let REW calculate EQ settings to smooth the FR, in the range from 30 to 600 Hz. I transferred the shown EQsettings (8 bell filters with center frequencies from about 80 to 500 Hz, different Q values and attenuation or amplification factors) to my DSP, made 9 new measurements at the same 9 listening positions as before and averaged them again. But the resulting FR curve looks considerably worse. The blue curve was without EQ, orange with EQ:

1678471073001.png


Where is the mistake? Can anybody help me, please?
 
Probably best posting the mdat file. Perhaps the target for the EQ was much too high at the low end.
 
Perhaps the target for the EQ was much too high at the low end.
I don't think so, I let the EQ "find" the target level.

Anyway, here is the mdat file.
 

Attachments

1678485751500.png


1678486235157.png

I transferred this into my DSP as follows:

1678486865288.png


Did I make a mistake, or misinterprete anything?
 
Last edited:
I can't get REW to produce the filters in the measurement you attached using those filter tasks settings, it consistently comes up with 13 filters with 7 of them below 80 Hz, so that's a puzzle.

The target level is low because the target is set for full range with a 30 Hz low end roll-off but the measurement rolls off from about 500 Hz and is about 18 dB down by 2 kHz, so the target level is being pulled down by the rolled off high end. Perhaps a suitably configured Driver target would be more appropriate, or a manual adjustment of the target level to accommodate the response shape.

What is your DSP?
 
Thank you, John!

The filters produced by REW often puzzled me in other cases, but until yesterday they always turned out to produce a significant improvement of the FR.

I wasn't aware of the possibilty to define my own driver target until now but defined one now. And I manually set the target level to 70 dB now. With this, REW gave me only one filter:

1678540721687.png


Seing the peak around 226 Hz this seems really odd, don't you think so?

Even when I increase the Flatness Target to 1 dB, it only generates 4 filters:

1678541190420.png


My DSP is an Omnitronic Smard-24RCA. It's a cheap one, but I already used it successfully a couple times, using (earlier versions of) REW the same way as I do now.
 

Attachments

  • 1678540538831.png
    1678540538831.png
    53.3 KB · Views: 24
@wus , are these measurements of JBL 305P?
If so then something seems not right.

This actual measurements of speaker from Erin’s Audio Corner

6935D679-D676-4116-9E5A-0192D118FECA.png


And estimated in-room response from those “anechoic” Klippel measurement:

8FD7BD6B-A8E4-41D6-A855-F5F661C4C5BD.png


The high end “average” measurement on your chart is obviously nowhere close.
 
The high end “average” measurement on your chart is obviously nowhere close.
I don't have Klippel test equipment, therefore I can't make comparable measurements. My setup is a Windows laptop running REW, a Focusrite Scarlet 8i6 USB soundcard, an ISEMcon EMX-7150 test microphone and a Technics SE-9021 main amp.
 
From your More "Front Speakers 2 x JBL 305P MkII"... If you are measuring one driver why not use one mic position to test with instead of 9 positions and averaging? Seems like it would be difficult to be exacting with that... Any reason your not using the latest REW 5.20.14+?
Following along as best as I can from the screen shots and posted .mdat file, with Equalizer setting Generic/Generic I get 20 filters, which I am sure is not what your looking for with your Smard-24RCA DSP... So this begs the question, what Equalizer setting are you using? You might try REW 5.20.14+ for a better selection here...
 
Last edited:
You aren't showing your target response and it looks like you have a house curve file loaded, which is added to the target. The differences we are getting are probably due to the effect of your house curve. What does the target look like compared to the measurement?
 
I don't have Klippel test equipment, therefore I can't make comparable measurements. My setup is a Windows laptop running REW, a Focusrite Scarlet 8i6 USB soundcard, an ISEMcon EMX-7150 test microphone and a Technics SE-9021 main amp.
Not many do have Klippel test equipment. LOL

Still the projected in-room response chart is usually highly accurate above 1000Hz or so, assuming you are measuring from 2 meters or more and are not more than 50 degrees off axis. If that's the case I'll stand by my supposition that something isn't right.

Perhaps John has the reason pegged in his post above.

Edit: Disregard above. Didn't catch that its a woofer only measurement. The JBL was in your equipment list. Sorry! :hide:
 
Last edited:
You aren't showing your target response and it looks like you have a house curve file loaded, which is added to the target.
My target response is a plain flat line. And I'm not adding a house curve, as can be seen in this (excerpt from above) screenshot:

1678561523515.png
 
You are adding a house curve, that's why HOUSE is shown next to the target response value. The filename will be shown on the House curve tab of the Preferences. To see the target select the Target trace, it is not flat.

1678562129663.png
 
You are adding a house curve, that's why HOUSE is shown next to the target response value. The filename will be shown on the House curve tab of the Preferences. To see the target select the Target trace, it is not flat.
Thanks a lot, that was the piece of information I had forgotten. Now that I see it (again) I remember that I experimented with house curves long ago, but then concluded that I better target a flat response... and forgot about the house curves:gulp: Until your "reminder" I thought house curve = room curve.

Thanks again!
 
Last edited:
With a (truely:redgrin:) flat target the EQ gives me many filters, more than my DSP accepts per (output) channel. I had to reduce the target flatness to 3dB to get the number down to 8 which I can enter into the DSP.

I will make a new series of measurements and compare again.
 
Last edited:
Until your "reminder" I thought house curve = room curve.
Thinking about this I wonder where is the real difference between house and room curve. Both basically "bend" the (theoretical) HiFi ideal of a perfectly flat FR, just for different reasons - ???
 
If you are measuring one driver why not use one mic position to test with instead of 9 positions and averaging? Seems like it would be difficult to be exacting with that...
We are talking about our living room here. We are not always listening from the same position - quite on the contrary. I identified 9 more or less typical listening positions that I then defined as spots to take my measurements.

If you know Denon AVRs, they also take measurements from 9 positions that they then average before they automatically apply their correction based on it. I'm doing basically the same manually, except that my positions are much more spread out in the room (no TV and no AVR here, it's just stereo). I know the result won't be perfect, but I'm trying to find the best compromise.

Reading about averaging in REW help again, I now wonder if the averaging method that I used - dB Average - is the right one for my purpose. Is it? Or should I better use RMS Average?

Some of my 9 listening positions are less likely than others. How can I create a weighted average where the more frequently used positions get more weight, and the least often used ones less?
 
Last edited:
I will make a new series of measurements and compare again.
I did that now and got much better results. It is not perfect, but that was expected. I will now continue with the 2nd woofer in the second (left) position.
 
Back
Top