Feature request: arithmetic operation MAX

Jean Ibarz

New Member
Thread Starter
Joined
Jun 23, 2017
Messages
40
More  
Preamp, Processor or Receiver
Computer
Main Amp
Gemini XP3000
Additional Amp
Samson SERVO 600
Other Amp
Samson SERVO 200 and Yamaha STR-DB840
Hi,

The request is to add a simple arithmetic operator to calculate the maximal frequency amplitude between multiple measurements (two measurements or a set of measurements like the RMS averaging).

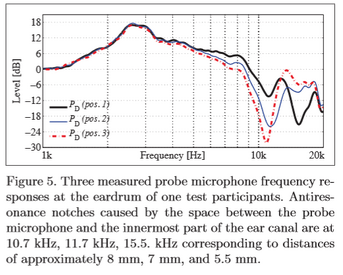
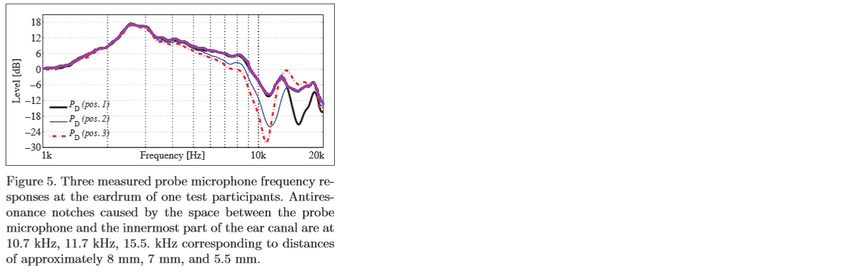
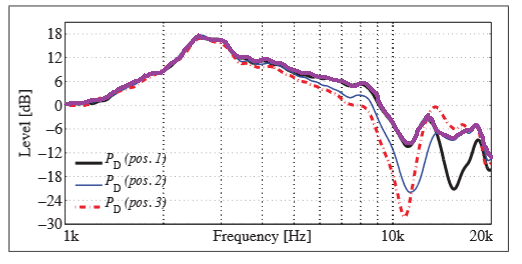
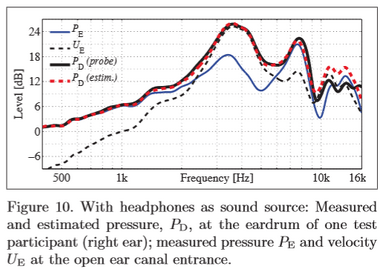
Why ? According to the paper "Estimating head-related transfer functions of human subjects from pressure-velocity measurements" from Marko Hiipakka, Teemu Kinnari and Ville Pulkki, and my understanding of this paper, a way to accurately reproduce the SPL signal at the eardrum is to estimate the total acoustic density in the ear canal. This is because the total acoustic density can be assumed constant in the ear canal and because total acoustic density ~= kinetic energy + potential energy, with kinetic energy being 0 because the eardrum have high impedance and therefore the air particles have no velocity, and the potential energy is directly related to SPL.

As a result, it may be interesting for researchers (or novices like me :p) to make multiple measurements with a microphone at different insertion depth in the ear canal. In some measurements, the SPL will be maximal for some frequencies, corresponding to a point in space where the kinetic energy is nearly 0, and hence by estimating the maximal SPL value of each frequencies in the ear canal, one may able to determine the total energy density (up to a squaring of the SPL value and a factor 1/2*rho*c² but this doesn't matter: what matters is the shape of the frequency curve).

I hope you will consider implementing this feature, because I believe that it may be possible that the total energy density would be the physical quantity that should be equalized in a Room, and not the SPL or the spectral average of multiple SPL measurements.

Best regards,
Jean
 
Last edited:

John Mulcahy

REW Author
Joined
Apr 3, 2017
Messages
7,212
You could use the RTA peak trace for that, with periodic pink noise as the stimulus.
 

Jean Ibarz

New Member
Thread Starter
Joined
Jun 23, 2017
Messages
40
More  
Preamp, Processor or Receiver
Computer
Main Amp
Gemini XP3000
Additional Amp
Samson SERVO 600
Other Amp
Samson SERVO 200 and Yamaha STR-DB840
Yes but it would require white noise in spectrum mode instead of pink noise with RTA, because we need raw frequency peaks and not peaks per bands.

It is also less convenient because the SNR is lower, the wires may have some "bad contacts" and you would have to restart all your measurements in case anything wrong happens during the measurement. By the way, its nearly impossible to spot if something wrong happens, compared with multiple individual measurements.

The feature would also allow to apply the analysis with already existing measurements, such as all available open source HRTF or BRIR databases.
 
Last edited:

Jean Ibarz

New Member
Thread Starter
Joined
Jun 23, 2017
Messages
40
More  
Preamp, Processor or Receiver
Computer
Main Amp
Gemini XP3000
Additional Amp
Samson SERVO 600
Other Amp
Samson SERVO 200 and Yamaha STR-DB840
Some BRIR measurements with 1/48 smoothing (the smallest available smoothing) :
32161


Not ok. The same measurements with no smoothing:
32162


Much better, especially for the estimation of the high frequencies amplitudes.

Same measurements with peak amplitude very slightly smoothed manually:
32163
 
Last edited:

Jean Ibarz

New Member
Thread Starter
Joined
Jun 23, 2017
Messages
40
More  
Preamp, Processor or Receiver
Computer
Main Amp
Gemini XP3000
Additional Amp
Samson SERVO 600
Other Amp
Samson SERVO 200 and Yamaha STR-DB840
Another example of a better treated room measurements:
32164


Applying the smallest amount of smoothing you get the usual dumb down slope in the high frequencies and irrelevant variations:
32165


It is even worse with 1/6 smoothing:
32166
 

Matthew J Poes

AV Addict
Joined
Oct 18, 2017
Messages
1,903
Can you explain a bit about what you did here?

They are listed as BRIR's but just show the spectral response. So is this the different steady state responses of various angles of the dummy head? I assume the dummy head response is being compensated for to give a free space equivalent measurement, correct?

At the end of the day, I wonder how big a difference this would really make. Maybe you can do some experiments based on listening tests that compare the two approaches? It seems one would require a flat target curve (peak energy) while the other would require a tilted curve (average spectrum). In fact, I wonder how different those two EQ curves would be, you could compare the frequency response of the EQ transfer function as a first step.
 

Jean Ibarz

New Member
Thread Starter
Joined
Jun 23, 2017
Messages
40
More  
Preamp, Processor or Receiver
Computer
Main Amp
Gemini XP3000
Additional Amp
Samson SERVO 600
Other Amp
Samson SERVO 200 and Yamaha STR-DB840
Hello Matthew,

The plotted BRIR have been download from Shanon Pearce's dataset, available here: https://github.com/ShanonPearce/ASH-IR-Dataset

I have taken the BRIR of the room 33 "R33" for the first plots, and I don't remember the room for the over plots (doesn't matter). Sure it's the spectral response of the BRIR, maybe I should have called them BRTF ? but this term doesn't seems to be used a lot in litterature though.

This is the spectral amplitude of the fourrier transform of the BRIR, measured from head and torso simulators for various sources directions (azimut), without elevation, for left and right ears. The BRIR have been equalized to be compatible with diffuse field equalized headphones, though I don't really understand how the process is done.

Maybe you can do some experiments based on listening tests that compare the two approaches? It seems one would require a flat target curve (peak energy) while the other would require a tilted curve (average spectrum). In fact, I wonder how different those two EQ curves would be, you could compare the frequency response of the EQ transfer function as a first step.

I am trying to do binaural audio reproduction and I have only one monitoring loudspeaker left for individual HRTF measurement. So I think it would be difficult for me to do subjective evaluations between different equalizations, done in bad listening conditions with a poor setup. However, it seems strange to me that the smoothed curve (the averaged curve would have a slope too though) is looking like the usual psychoacoustic target curves, with slope from 2khz to 20khz, while the peak amplitude is nearly flat. I know that the slope is necessary to give subjectively good results, and that the amplitude of the slope or the corner frequency can depend of the room size and/or characteristics, and that not everybody agree with this subject. I'm just wondering if, maybe, we should equalize to "flat" the total energy density (or sound intensity) instead of equalizing the SPL (which seems unreliable and variant between setups). My thoughts are just that by taking the envelope of the amplitude maximum, we get a better estimation of total energy density with SPL measurements, and that this "physical" quantity may be more reliable for system calibration.

Some researchers have proposed methods to compensate the frequency response of headphones by using the mean value + 2*sigma with different measurements, but I think it is quite similar as taking the maximal values (which is simpler but maybe a little bit less robust to outliers), see this article for example: https://scholar.google.com/scholar?hl=fr&as_sdt=0,5&q=Perceptually+robust+headphone+equalization+for+binaural+reproduction&btnG=

I don't know if it's okay to post plots from the article, but if it's not please let me now and I will remove them:
33829


When using mean + 2sigma, the resulting amplitude is greater when the variance is higher (in high frequencies). With maximum values, the result is maybe a little bit "less reliable", but it is simpler to implement, that's why I didn't ask for an arithmetic operation that could calculate the mean+Ksigma between a set of measurements.

In an article from Marko Hiipakka, Teemu Kinnari, and Ville Pulkki, which seems to be now publicly accessible on ResearchGate so I join the article in this message, they explain why it is possible to estimate the pressure at the eardrum by estimating the total sound energy at the ear canal entrance. The explanation is really good and makes totally sense for me. Without entering too much into details, they argue that if there is negligible energy loss in the ear canal, then total energy density (potential energy density ~ SPL + kinetic energy density ~ particle velocity) is the same in the ear canal entrance and at the eardrum, and if we assume the eardrum is a sound hard boundary, we should have particle velocity = 0 so total energy density ~= potential energy density ~ SPL.

Here are interesting plots from the article:
33831


We see in the left two plots, that modeled (or measured) pressure responses at the eardrum is alway greater than the modeled (or measured) pressure at the ear canal entrance. And this is normal because it is assumed that there is no energy loss and there is negligible particle velocity near the eardrum, hence 100% of the sound energy is potential energy, which is measured via the SPL. I think that repeating the measurements with different insertion depth, we should be able to "approach" the pressure reponse at the eardrum because everytime we get an amplitude maximum, we have a resonance, hence particle velocity is negligible and hence total energy density ~= potential energy density ~ SPL.

Conclusion of all that:
1) I think total energy density or sound intensity is better to calibrate a system than SPL.
2) I think that taking the maximal values (or mean + Ksigma as proposed in the first linked article) may leads to a better estimate of total energy density from a set of measurements, at least for ear canal measurements where stationary waves are important in high frequencies.
3) I think smoothing measurements with high variance (typically in the high frequencies), even by the smallest amount, leads to overattenuated ampliutde, which usually create a slope in the high frequencies that is not relevant and should not be.
 

Attachments

  • 1596187056364.png
    1596187056364.png
    26.4 KB · Views: 11
  • 1596187364427.png
    1596187364427.png
    25.6 KB · Views: 9
  • 1596187387247.png
    1596187387247.png
    10.2 KB · Views: 11
  • 1596187499456.png
    1596187499456.png
    24.5 KB · Views: 11
  • Estimating pressure at eardrum with pressure-velocity measurement from ear canal entrance.pdf
    1.1 MB · Views: 10
Last edited:

Jean Ibarz

New Member
Thread Starter
Joined
Jun 23, 2017
Messages
40
More  
Preamp, Processor or Receiver
Computer
Main Amp
Gemini XP3000
Additional Amp
Samson SERVO 600
Other Amp
Samson SERVO 200 and Yamaha STR-DB840
Maybe one could take a set of raw SPL responses, calculate mean and variance, calculate a new response = mean+K*sigma (K being customisable but good values would be probably 2 or 3), then taking the amplitude envelope to get something like a smoothing but without being a smoothing :p. Or apply a response smoothing, but after that we should compensate the amplitude as a function of the variance between consecutives frequencies or something like that (this maybe tricky and non trivial at all to get the correct amplitude compensation) : I think you get the idea !
 

Jean Ibarz

New Member
Thread Starter
Joined
Jun 23, 2017
Messages
40
More  
Preamp, Processor or Receiver
Computer
Main Amp
Gemini XP3000
Additional Amp
Samson SERVO 600
Other Amp
Samson SERVO 200 and Yamaha STR-DB840
A set of measures using two electret microphones glued together in order to make a lot of measurements with different insertion depth in the ear canal:
33833


The measurements are available here in .mdat format: https://drive.google.com/file/d/1-bpPEWHvgM7Ttj_WD2mzKiBleyre3WHY/view?usp=sharing

The source is a monitoring loudspeaker JBL 3 MK II. My head was positioned 50cm in front and up to the loudspeaker. This information is quite useless anyway as the microphones are not calibrated.... And I don't expect anything from the measured frequency responses, it is just to show the difference between an RMS average and the proposed operation.
Measures suffixed with "-front" correspond to the microphone on the left in the previous picture (the one that has the deeper insertion depth), while the measures suffixed by "-rear" correspond to the microphone of the right (the one that has the lesser insertion depth). I pushed the microphones until it nearly touches my tympanic membrane, then I pulled the microphones by about 1-3mm. each time. For each position, I made a pair of measurement (one with each microphone). "depth0" corresponds to the lowest insertion depth, "depth10" to the deepest insertion depth.

Here are all the frequency responses, with an RMS average in green:
33834


Again according to my previous messages, I think it would be interesting to get something that looks like the maximum envelope of all measurements, or something like the mean + K*standard deviation, in order to get an approximation of the frequency response of the total energy density through this set of SPL frequency responses:
33836
 

Attachments

  • 1596200707727.png
    1596200707727.png
    272.7 KB · Views: 9
Top Bottom