Excess group delay?

cvanc

New Member
Thread Starter
Joined
May 29, 2020
Posts
30
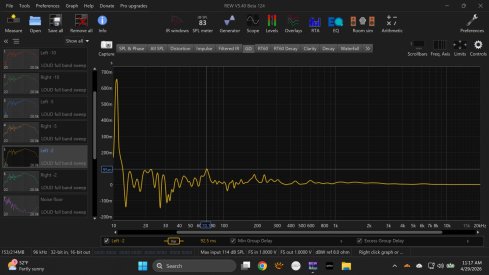
Hi all, a couple questions about the attached sweep. I want to make sure I navigated the menus right so my first question is simple, does this look like a proper display of EGD? Second, your opinion please of the measurement itself - is it considered to be good or bad overall? I'm just diving into EGD for the first time; appreciate any insights.

excess group delay 2.jpg
 

Attachments

  • excess group delay.jpg
    excess group delay.jpg
    196.5 KB · Views: 21
Last edited:
Yes, that looks like what I would expect to see in a GD graph. I interpret it together with the amplitude response. One of my minor quibbles with REW is that it does not let you view two different types of graph together. I would like to see a split screen view with the amplitude response on top and the GD graph at the bottom.

I happen to have REW open with a measurement of my friend's system so here is a quick illustration for you. I have drawn some lines to indicate points of interest:

1777518776006.png


Flat portions of the graph is the minimum-phase portion of the measurement, meaning it can be inverted. All the spikes you see are excess phase, i.e. are non-invertible. So to read this graph, we can see that the FR is dropping off below 40Hz, so we ignore all the EP GD spikes below 40Hz because it's noise. That large dip at 60Hz has a rather complex looking EP GD spike associated with it. Attempting to correct this with a reverse all-pass (AP) filter will likely produce a lot of ringing for minimal benefit since it is difficult to match the Q of the correction to the Q of the spike. That EP GD spike at about 220Hz is associated with a dip in the frequency response, so it will likely benefit from a reverse AP filter (in the same channel) or a normal AP filter in the opposite channel, with the caveat that it's occurring relatively high in the freq response so it MAY be better to leave it alone.

Note that the only way to implement a reverse AP filter is if you have linear-phase DSP.

You can read what John said about EP GD here and here.
 
Flat portions of the graph is the minimum-phase portion of the measurement, meaning it can be inverted.
If you are analyzing excess group delay. In your example, it is not clear which group delay graph is shown.
 
Last edited:
Back
Top