Attached is a sub measurement. When I look at a Waterfall chart, it looks like 60 Hz goes on for more than 800 ms, for example:

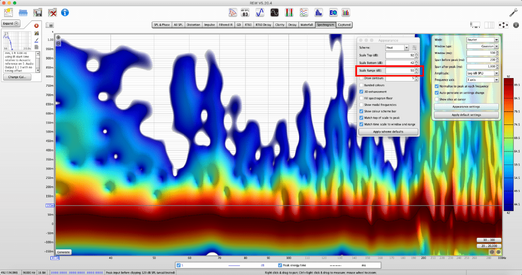
But when I look at a Spectrogram chart, it looks like 60 Hz stops in less than 300 ms:

What's accounting for the difference, and which one should I pay attention to?
But when I look at a Spectrogram chart, it looks like 60 Hz stops in less than 300 ms:
What's accounting for the difference, and which one should I pay attention to?


