An unwanted smoothing

bobolix

Registered
Thread Starter
Joined
Feb 11, 2018
Messages
32
It seems if a frequency-dependent window is used or a time offset is applied, there some smoothing is forced (it appears to be 1/48) that cannot be removed. The storage of the measurement is also affected by it, as a result of which the frequency response of the pulse is then returned only as smoothed, not original, even if the pulse appears to be intact - probably the smoothing has been somehow included in the data file. This represent a certain unnecessary loss of information about the details in the frequency domain, which, if using the time shift or adaptive windowing, cannot be avoided.
 

Attachments

  • Mezi kozy 46_5 podstav.mdat
    9.1 MB · Views: 7
  • Mezi kozy 46_5 podstav aligned.mdat
    8.1 MB · Views: 2
Last edited:

John Mulcahy

REW Author
Joined
Apr 3, 2017
Messages
7,212
A frequency-dependent window has an inherent smoothing effect, as frequency increases the window gets narrower and so frequency resolution is reduced correspondingly.

Time offsets do not themselves cause any smoothing, though the preview that is shown is a 96 PPO log-spaced trace. There is an option in the Analysis Preferences, Frequency Response section called "Allow 96 PPO log spacing" which has an effect, however. From the help:

The Allow 96 PPO log spacing selection controls whether REW is permitted to convert frequency responses from linearly spaced data to logarithmically spaced data at 96 points per octave. The FFT that calculates the frequency responses produces data that is linearly spaced in frequency, i.e. there is a constant frequency step from each value to the next. For the high frequency parts of responses this means there are a very large number of points, using a lot of memory but not contributing anything useful to the displayed data. When this option is selected (it is on by default) REW will automatically convert frequency responses to more efficient logarithmic spacing with 96 data points in each octave of the response if this will reduce memory usage (which is usually the case for sweeps that end above 300 Hz or so). As part of the conversion process REW first applies a 1/48th octave smoothing filter to the data to remove any high frequency combing from the response. The conversion takes place on any new measurement or when an IR Window is applied. Whether a measurement is log spaced or linearly spaced can be seen by bringing up the measurement info window by clicking the info button in the toolbar.

Note that conversion to 96 PPO is inhibited if the impulse peak is far from the impulse zero time, where "far" means the peak is offset from zero by a time that corresponds to more than 90 degrees of phase shift between samples at the measurement end frequency. This is to prevent aliased phase data at high frequencies which would lead to incorrect group delay figures.


If you turn that option off then reapplying the IR window will change the response back to linear spacing and smoothing can be removed.
 

bobolix

Registered
Thread Starter
Joined
Feb 11, 2018
Messages
32
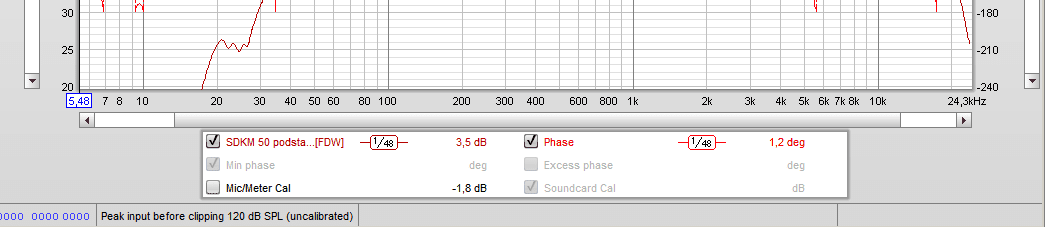
A frequency-dependent window has an inherent smoothing effect, of course, but if the frequency dependence of the window is removed (the box unchecked and window applied again), the smoothing 1/48 remains and must be removed manually in the Graph menu. So in fact it seems it is impossible to create the frequency response only with the inherent smoothing by the frequency dependence of the window, as the additional 1/48 smoothing is present still if the frequency dependent windowing is enabled (and applied).

Concerning the smoothing at the time offset applying, my approach is as follows:
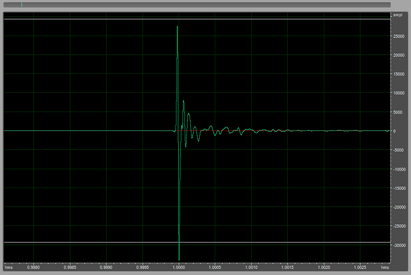
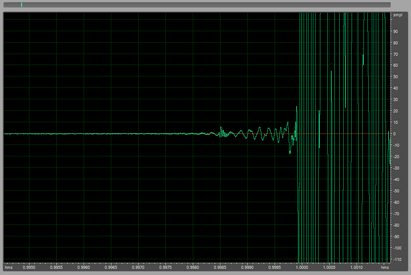
1. I create the frequency response, i.e. magnitude and phase, of the native impulse response of some loudspeaker driver, where the initial time is some miliseconds e.g.
2. I set the time offset manually so that the phase response correspond with the presumed phase response, so far is all O.K.
3. I apply the time offset set by appropriate clicking. And, what a miracle, the response curves turn to the smoothed appearance, again as 1/48.
4. I save the result in a separate file.
5. I recall the measurement from this file and the responses are smoothed still, although no smoothing was applied explicitly, though, the impulse response is the same as the original, except of the time delay correction, of course.

The examples of the measurement both as original and with the time offset (1.465 ms) applied are above (note the file containing the offsetted measurement is a little bit smaller than the one containing the raw original, although the impulse responses are the same).

I note the "smoothing" appears if the time offset is long sufficiently only; the minimum value for the example as above is a little bit more than 0.18 ms without any transition or warning (at exactly 0.18 ms no smoothing appears). I simply don't understand this behavior of the REW.

Soo ... so that is by my eyes :rubeyes::olddude:. Am I out of bowl totally ?:banana::dizzy::eek:
 
Last edited:

John Mulcahy

REW Author
Joined
Apr 3, 2017
Messages
7,212
The answer is already posted above, but I will rephrase it.

REW has an option in the Analysis Preferences, Frequency Response section called "Allow 96 PPO log spacing". It is on by default. When that option is selected REW will, if possible, convert the results of windowing the IR (which can happen for many reasons) to a 96 PPO log spaced format. If a measurement is being converted to 96 PPO it must first be smoothed to 48 PPO, otherwise the conversion would cause aliasing. Measurements that are in 96 PPO log spaced format must always have at least 48 PPO smoothing.

You can see if a measurement is log spaced or linear spaced by looking at the measurement info Freq spacing value, here is an example of a log spaced measurement:

34180


Here is an example of the measurement with linear spacing:

34181


Even if the Allow 96 PPO log spacing option is selected a measurement will not always be converted to log spacing. Conversion to 96 PPO is inhibited if the impulse peak is far from the impulse zero time, where "far" means the peak is offset from zero by a time that corresponds to more than 90 degrees of phase shift between samples at the measurement end frequency. This is to prevent aliased phase data at high frequencies which would lead to incorrect group delay figures.

  1. If you do not want log spacing to be allowed, deselect the Allow 96 PPO log spacing option.
  2. If you have measurements that are log spaced and you want them not to be, make sure the Allow 96 PPO log spacing option is not selected and re-apply the IR window.
 

bobolix

Registered
Thread Starter
Joined
Feb 11, 2018
Messages
32
Thank you very much for the answer. Really (and surprisingly for me) the time offset affect the frequency response appearance if applied, dependently if the 96 PPO is allowed or not. What I wrote is valid only if the 96 PPO is allowed in the Preferences / Analysis therefore apparently. But, the time offset setting influenced the result. Here is result of my "exploration":

1. I recall a measurement, where no time offset was done. The 96 PPO is unchecked. The frequency response is O.K., i.e. without smoothing.
2. I check 96 PPO. Apply the IR window. Nothing happened.
3. I uncheck 96 PPO. Set the time offset to 1.455 ms. Apply. Nothing happened with the SPL curve, the phase response is changed appropriate way. Repeated IR windowing doesn't change anything.
4. I'm keeping the time offset and check the 96 PPO. Nothing is happened this moment, but after applying the IR window again the SPL is rendered to the smoothing 1/48.
5. Uncheck 96 PPO, keep time offset, apply window. SPL curve remains the same although not exactly and the 1/48 smoothing is active still. After removing the smoothing manually the SPL curve returns to its unsmoothed appearance, as it was in the beginning.
6. Keep 96 PPO unchecked, set the time offset to -1.355 ms to make the cumulative offset 0.1 ms. Apply the IR window. The SPL curve remains in the unsmoothed appearance. If the 96 PPO is allowed and the window applied then, the history repeats, the smoothing 1/48 is introduced. And, in general, it seems if this smoothing is activated due the combination of 96 PPO enabling and time offset introducing, then the smoothing cannot be removed manually; at least, I can't to do so.

Now I know how to obtain the wanted frequency response with the time delay and without the smoothing, but I don't understand, why the smoothing is beeing set automatically under condition as described.:confused:
 

John Mulcahy

REW Author
Joined
Apr 3, 2017
Messages
7,212
If a measurement is log spaced it will always have 1/48 octave smoothing (or any greater smoothing you apply).

If you don't want that don't select the option to allow 96 PPO log spacing.
 

bobolix

Registered
Thread Starter
Joined
Feb 11, 2018
Messages
32
I'm sorry, but I've made several test and it seems to me still the "automatic" 1/48 smoothing takes place only if certain positive time offset is set simultaneously. If the time offset is zero, then no smoothing appears even if the log spacing 96 PPO is allowed / checked.
 

John Mulcahy

REW Author
Joined
Apr 3, 2017
Messages
7,212
Even if the Allow 96 PPO log spacing option is selected a measurement will not always be converted to log spacing. Conversion to 96 PPO is inhibited if the impulse peak is far from the impulse zero time, where "far" means the peak is offset from zero by a time that corresponds to more than 90 degrees of phase shift between samples at the measurement end frequency. This is to prevent aliased phase data at high frequencies which would lead to incorrect group delay figures.
 

bobolix

Registered
Thread Starter
Joined
Feb 11, 2018
Messages
32
.I understand, really. However, what I don't understand is how and why the decision between "smooth or not-smooth" depends on whether or not time offset is used. By the way, the time difference between zero and the peak of the pulse certainly does not depend on the time offset, but the presence of smoothing does. And something else - which is actually or how the pulse zero is defined - see the attached pictures.
 

Attachments

  • imp2.png
    imp2.png
    5.7 KB · Views: 11
  • imp1.png
    imp1.png
    6.6 KB · Views: 10
  • imp3.png
    imp3.png
    8.2 KB · Views: 11

bobolix

Registered
Thread Starter
Joined
Feb 11, 2018
Messages
32
It seems I don't understand what is the peak and zero. The shape of the pulse can not change depending on the use of any time offset applied, after all. And, if the position of the zero and peak is derived from the shape, i.e. from the time run of the impulse, how the difference between them can depend on the time offset applied ?

I evaluate usually the measurements of multiway speakers. If I want obtain correctly time-aligned results, then I must set the time offset so that the phase response of the driver being minimally delayed by distance of microphone were near as possible to the minimum phase response of the driver. The other drivers measurements is then set to the same time offset. And, as I use the time dependent window, I must set the window reference time to the impulse beginning, i.e. to its threshold. The position of the peak is interesting, of course, but not important in fact. What bothers me a little is the 1/48 smoothing introduced if the time dependent window us used, which cannot be removed. This does not depend on the 96 PPO checking or unchecking, btw.

I must apologise for my english, but I use to think in czech and some ideas simply cannot be translated exactly. This is the main problem maybe :sneaky:.
 

jtalden

Senior Member
Joined
May 22, 2017
Messages
887
Location
Arizona, USA
More  
Preamp, Processor or Receiver
Marantz AV7705 Pre/Pro
Main Amp
VTV 6 chnl NC252MP P-amp x 2
Additional Amp
Behringer DCX2496 x 2
Universal / Blu-ray / CD Player
OPPO BDP-103 Universal Player
Front Speakers
DIY SEAS H1456/H1212 Spkr x 5
Subwoofers
DIY JBL 2235H 15" SW x 2
Video Display Device
JVC DLA-X790R
Screen
Da-Lite Da-Snap 39105V - 92"
You have now explained that your objective is to time align drivers in a loudspeaker system based on the measured phase relationship of the drivers. That process is easy to accomplish by using the REW 'Alignment tool' feature. See the REW help for the tool controls and find more information in this thread. The conventional objective is to provide close phase tracking of the direct sound throughout the XO range. For midrange or high frequency XOs it is helpful to use a 0.5 to 1.5 m mic distance to minimize the room influence. For a SW XO the FDW is helpful to remove the room influence as the mic needs to be at the LP.
 

John Mulcahy

REW Author
Joined
Apr 3, 2017
Messages
7,212
It seems I don't understand what is the peak and zero. The shape of the pulse can not change depending on the use of any time offset applied, after all. And, if the position of the zero and peak is derived from the shape, i.e. from the time run of the impulse, how the difference between them can depend on the time offset applied ?
The response lies along a time axis. The time corresponding to t=0 on that axis may lie anywhere, it is not a property of the response plotted along it. The start of the response (in the sense of its causal nature) may be at t=0 or it may not, if it were always at t=0 you wouldn't ever have to do any time alignment. Time delays in the response (or delays relative to some other response chosen as a reference to define t=0) mean the start of the response is not at t=0. The position of the response peak relative to the t=0 point on the axis is a proxy for time delay, if the time delay is not sufficiently small the rate of change of phase at the end of the response would be too large to be represented using 96 PPO without aliasing.

What bothers me a little is the 1/48 smoothing introduced if the time dependent window us used, which cannot be removed.
A frequency dependent window may alternatively be described as a window whose width is a constant octave fraction. It is meaningless to refer to an "unsmoothed" response if the response has been obtained from a frequency-dependent window. It makes no more sense than asking to see a windowed response without the windowing.
 

bobolix

Registered
Thread Starter
Joined
Feb 11, 2018
Messages
32
A frequency dependent window may alternatively be described as a window whose width is a constant octave fraction. It is meaningless to refer to an "unsmoothed" response if the response has been obtained from a frequency-dependent window. It makes no more sense than asking to see a windowed response without the windowing.

It is really clear for me what relationship is between the dependence of the dependence of the window length on frequency and the native smoothing resulted therefrom. As I mentioned sooner yet, I have lot of years experience with the acoustic measurements including the original DRA MLSSA technology (also with the "adaptive window", which is similar to the FDW of Blackman-Harris kind in this case). The topic I discussed is not the native smoothing due the dependence of the length of the window on the frequency, but the additional smoothing 1/48 introduced by REW implicitly if the FDW is used, which cannot be removed manually. See the picture attached. Here is the smoothing 1/48 mentioned. Pressing Ctrl+Shift+0 doesn't change anything. Removing the FDW reveals some subtle details in the FR, but the smoothing remains (it is noted in the lower window still). Pressing the Ctrl+Shift+0 only now reveals the FR in all its untouched beauty with all effects of the reflections.

In fact, I don't assume the case of the "additional smoothing" to be too important, because the smoothing due FRD applying is far more radical usually. However, I'd like to have the option to see the response processed by the FRD only. And, after all the smoothing can be applied manually anytime, if needed.
 

Attachments

  • Pic1.png
    Pic1.png
    7.2 KB · Views: 8
  • SDKM 50 podstavec.mdat
    8.4 MB · Views: 5

John Mulcahy

REW Author
Joined
Apr 3, 2017
Messages
7,212
There is no additional smoothing. The result of the FDW has no content beyond 48 PPO so it is simply sampled at 96 PPO. REW will show 1/48 smoothing (i.e. 48 PPO) for 96 PPO log spaced data since it would violate sampling theory for there to be any content above 48 PPO. If it helps, read the 1/48 smoothing indication as "This data is log spaced at 96 PPO".
 

bobolix

Registered
Thread Starter
Joined
Feb 11, 2018
Messages
32
You have now explained that your objective is to time align drivers in a loudspeaker system based on the measured phase relationship of the drivers. That process is easy to accomplish by using the REW 'Alignment tool' feature. See the REW help for the tool controls and find more information in this thread. The conventional objective is to provide close phase tracking of the direct sound throughout the XO range. For midrange or high frequency XOs it is helpful to use a 0.5 to 1.5 m mic distance to minimize the room influence. For a SW XO the FDW is helpful to remove the room influence as the mic needs to be at the LP.

I have no problems with the time alignment. As I'm a loudspeaker developer and designer, I need only the measurements of the single drivers such a way so they will be aligned in time properly, so than their phase response curves would be describing the properties of the drivers properly and would be clear. And that I can do.
 

bobolix

Registered
Thread Starter
Joined
Feb 11, 2018
Messages
32
There is no additional smoothing. The result of the FDW has no content beyond 48 PPO so it is simply sampled at 96 PPO. REW will show 1/48 smoothing (i.e. 48 PPO) for 96 PPO log spaced data since it would violate sampling theory for there to be any content above 48 PPO. If it helps, read the 1/48 smoothing indication as "This data is log spaced at 96 PPO".
O.K., understood. The confusion is caused perhaps also by the fact that if the FDW is removed and the (say long rectangular) window is reapplied, the 1/48 smoothing of the response curve remains, it is also notified and can be removed manually. Probably the adaptive windowing in MLSSA works another way that the FDW in REW.
 
Last edited:
Top Bottom