Wy the much better measure with less noise did not show EDT T20 T30 ?

user44455555

Registered
Thread Starter
Joined
Jan 16, 2021
Posts
256
Hi

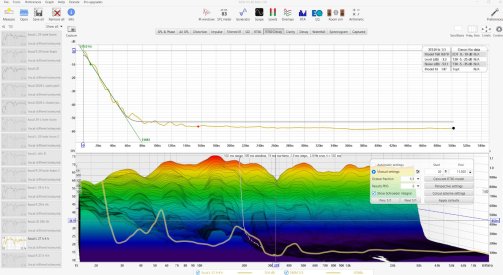
I drill 40 mm holes in my wardrobe doors, to use it as a resonator to damp low freq. better sound and the results and decay shape get much better, but it did not show T20 or schroeder integral in RT60m decay i have enable that. it happen also on my other measures mostly not work only sometimes. what are the rules to see always such results ?. for edt T20 and T30 i think is not so much SNR need.

more measures form me with diffrent hole count for compare can see here . holes give the best and cheapest low freq enhancement and clarity enhancement. can hear and measure https://www.avnirvana.com/threads/w...cisions-on-what-to-do-next.16827/#post-124451

focal L worse but show t20 t30.jpg


here the better SNR and decy shape but no EDT no T20 T30
focal L good show no t20 t30.jpg
 

Attachments

Last edited:
You have to generate the classical results on the RT60 graph for the octave fraction you want to view.

maybe rew can do in rt60 decay also the calculation that is need for T20 T30, because wy should use the old rt60 anymore ? and what is model fit .is then 0 best ? .google ai tell that value more near 100% is better. same room and treatment, speaker position, mic position but diffrent speaker. with the d3v i get at 226 hz 0.87 . with the focal alpha 65 evo it is 3.99 . so i assume smaller value is better when look on the curve. I notice very often when i set the cursor to for example 226 hz and i switch to diffrent measure the cursor time change. . also manual setting can not avoid it. Is there a way to avoid cursor time jump so on all measure same when i switch to other measure without change the cursor ? I click only on left side the measure and cursor change from 296m to 178m.

see here the diffrent cursor time.the focal measure

focal time 296ms.jpg


the d3v measure. you can see speakers have huge influence of decay time together with room. the classical rt60 is not precise enough to show the peaks exact
act

d3v  time 178 ms.jpg
 
This is very odd, there should only be two traces in the legend for this graph, it seems to be showing traces from the SPL & Phase graph. Please use the Help menu option to generate a diagnostic file and send it to me.

1780139247973.png
 
This is very odd, there should only be two traces in the legend for this graph, it seems to be showing traces from the SPL & Phase graph. Please use the Help menu option to generate a diagnostic file and send it to me.

View attachment 93069

this happen sometimes, i wonder too, wy it show min phase and excess phase in gray. it di not display anything wrong. It show also a grey S. In test now i can not reproduce it, only the grey s is show. or is the grey s normal ?
2026-05-30 14-25-12-341.jpg
 
I have found how the extra traces appear, it's a side effect of removing a measurement. I have fixed it for the next build.
 
It indicates how well the decay matches the model of exponential decay + noise, smaller numbers mean a better match to the model.

I notice the model fit is also a excellent thing to see quality of speaker and treatment. maybe you think model fit show better als the clarity value, so you like add a model fit display in opverlays that show for 12 bands (each note of music) the smoothing model fit ?

I dont want do nitpicking with that test, but it show enough diffrences between warm and cold in bass model fit because of less damping of speaker when it is warm. that level is upto 3 db lower when it is warm is maybe because the amp of speaker or apollo sole ampliefied diffrent on cold or hot which doesnt matter because it happen on both channels

I have done with exact same microphone and speaker position measurement when it is warm 29.5 celcius in evening and 24.6 celcius when cold in the morning. AI tell that when it is warm the speaker damping is less, so get more low bass but worser decay times. both can see in the measures and also in the cold measures model fit is 2.14 and second measure 2.44 but on the warm measure it is 5.9 at 48.8 hz. so the warm and cold measure can use to see how can speaker enhance. sure the audio speed is faster on warm but this did not explain the 2.4 db more bass at below 50 hz when i do spl align. the level is lower
mehr bass.jpg


model fit good.jpg


model fit bad in warm evening
abend.jpg
 

Attachments

I notice the model fit is also a excellent thing to see quality of speaker and treatment.
Not really, it just shows how well the underlying RT60 assumption of a diffuse field holds for that particular part of the measurement. In acoustically small rooms the model fit will generally get worse at lower frequencies, where modal behaviour dominates, and get better above the room's transition frequency.
 
Back
Top