I listen to music on three systems -- one car with the optional Harman Kardon system, another car with a Bowers and Wilkins system, and my modest Yamaha/ Klipsch bookshelf system. My favorite is the B&W system, but I'm not sure
what makes it better, except that everything seems
cleaner and clearer somehow. The frequency responses of the B&W system (green line) and my home theater system (red line) are system below.
View attachment 87328
I may have found part of the reason why the car system sounds better... VOLUME. Before I started my pink noise RTA recording in the car, I set the volume to the "Dad's rocking out" setting, approximately 80 dBA on a favorite tune. OK, fine. But, when I went inside to repeat the measurements at the same volume in my home, all I can say is "Yikes!". I'm glad nobody else was home. The windows were rattling. I'd never listen at that volume at home.
It's often said that the music seems to "open up" as you increase the volume and I seem to be much more comfortable with high-volume listening in the car. That may be one reason it sounds clearer to me.
What else contributes to clarity?
I am responding to this simply because somebody or a bot sent this msg:
If you get a minute and can jump in on this thread of the week, we'd love to hear your thoughts:
Where Does Clarity Come From?:
https://www.avnirvana.com/threads/where-does-clarity-come-from.15973/
In the past, I have tried to respond carefully, but my opinions were sometimes not appreciated. But given the invite, I will give it a go.
I agree with fattire’s comments, they are an expansion of an industry-defined acoustic measurement found in REW called CLARITY. One difference is that it is simply the measurement of the ratio of energy arriving directly from the source (the first 50-80mS) of sound to that arrives later. It is expressed in dB, with higher numbers being better. So, a well-damped room, say with a broad and flat Rt60 of 450mS or less, or outdoors, will have very good clarity for any given speaker(s). A car, by definition, is a very small room, and so the reflections are concentrated in the early arrival range, so it can have good clarity. It is well known that early arrivals promote a lack of imaging specificity.
Horn speakers are more directional, so they beam much of the energy directly to the user’s ear, thus often have good clarity. Headphones have great clarity.
However, here we are talking about subjective impressions of clarity, which is a much different thing. Certainly, one person’s feeling about how clear one system is vs another depends on what one includes in this definition. I can see that broad dynamic range, low noise, smooth on- and off-axis response, and the lack of prominent reflections after the first arrival would enhance clarity.
To illustrate some of these points, here are a few measurements from a friend in Bangkok, Thailand, that I am currently helping. Since I am long way from there, I have to use his ears and hundreds of measurements to optimize the system.
This is a large room, 30' L x 18' W x 12’ ceilings. the walls are slightly curved. There is NO EQ because he doesn't have this capability, but the room has been treated with a bare minimum of acoustic materials (absorption and diffusion) and to the extent his wife allows. Here we used just a few hundred dollars worth including a few he DIY'd.
All these are R channel only. The speakers are significantly repaired and slightly tweaked Dahlquist DQ10 from the early 80s. Because he had no EQ available all response adjustments were done using the curves as shown below- through 5 major iterations. Hundreds of curves total. I lost the original curve but it was +/- 15dB as I recall.
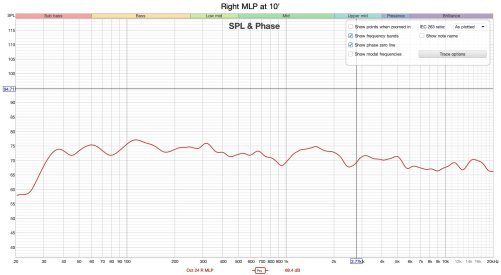
The 1st curve Right MLP is simply the at R ear measurement of magnitude response. It is a little bumpy but about as good as you can get with DQ10's given their design philosophy (mainly the GEN1 crosstalk cancellation design). It closely follows my preferred MLP curve which is a mutation of the Bob Katz and Harmon curves with my preferences added in. It should noted it has gradually mutated over a nearly 100 peoples systems whom I have helped set up.
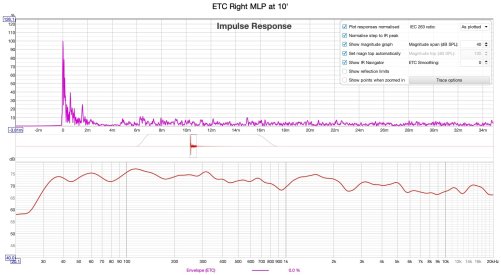
The 2nd is the Energy Time Curve (ETC). Here you can see well-controlled reflections, except for one at 6.4mS. I try as much as possible to keep all reflections below 10% of the 1st arrival. This curve is the primary basis of the clarity curve.
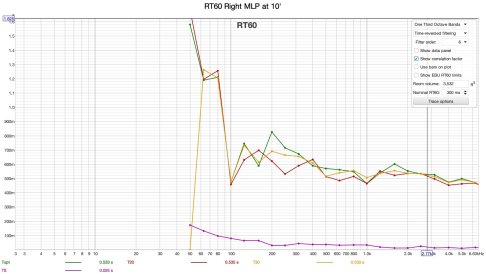
The 3rd is ROOM RT60— you will note this is not perfect but acceptable above about 100Hz. I also allowed it to rise above below 400Hz because enough bass absorbers were too big to fit the minimal room esthetic. I could have improved this, but the large LIMP mass absorbers I designed did not fit the WAF criteria.
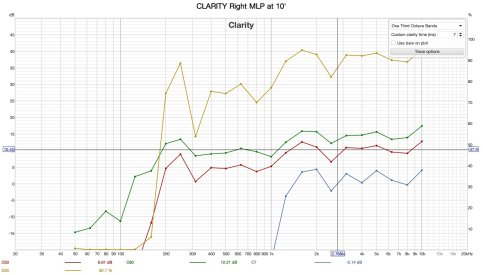
The 4th is the CLARITY curve. Besides the usual C50 /C80 curves, I have included my preferred C7 curve. Recall the number after C is the number of mS that are included in the direct/reflected sound ratio calculations. I use C7 to judge imaging clarity, specificity, and positioning accuracy.
Note that these graphs all come from the SAME data. They are just mathematical transformations of the original amplitude vs time data.
If you are familiar with these curves you will see the relationships between them and have some insight into what affects what.
If not And if you are interested I can answer questions. It has taken me about 40 + years at about 5 hours of study per week to get to the point where I can do this remotely.
This particular individual had (self admittedly) no math and a weak science background so it took bit longer. He reports the sound to be greatly improved to the point where his wife even noticed it without prompting.