Tweeter responce ok each channel, bad with both both channels

truwarrior22

Registered
Thread Starter
Joined
Mar 22, 2021
Posts
3
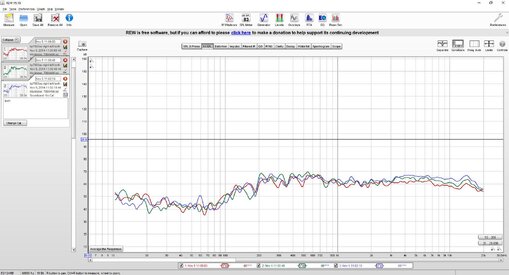
Each speaker, i.e. the first two measurements, the response looks good, but when I measure both speakers at the same time, the tweeter frequency looks horrible. Any suggestions? 2nd measurement of both speakers (purple) was a foot further back. Speakers are Sonus Faber Toy towers hooked up to Marantz in pure direct mode.

40429
 
That's quite normal, when both speakers play any slight difference in their distance to the mic results in comb filtering, causing peaks and notches in the combined response.
 
That's quite normal, when both speakers play any slight difference in their distance to the mic results in comb filtering, causing peaks and notches in the combined response.
Thanks, I'm just not use to THAT much of a difference. I thought it's more of a low frequency room mode issue. Here's my BP7000SC before I sold them (subs were off). Overall, the higher frequencies very good, but these are bipolar. I did have the BP7000SC on another wall, but same room. I'll check speaker positioning then try again, just not sure what's going to be best to treat this, unless it's just a positioning issue. Seems to be only anything above 5K
 

Attachments

  • BP.jpg
    BP.jpg
    160.6 KB · Views: 26
The reason the BP7000 graph looks so “good” is because it does not have the same vertical scaling as the Sonus graph.

Regards,
Wayne
 
@Wayne A. Pflughaupt is correct. In fact, the range on the first posted image is 65dB. The range on the second image is 155db. Vertical scaling like that will obscure the details in the graph and make your measurements appear 'better' than they actually are. Set the scaling to be 5db higher than the peak of the measurement at the top and set the bottom of the scale 50bd down from there.

In the case of the first graph, the top would be set at 100db and the bottom set to 50dB. The second graph should have the top of the scale at 75dB and the bottom at 25dB. Using a consistent scaling for your graphs will give a reliable framework to judge the measurements with.
 
The reason the BP7000 graph looks so “good” is because it does not have the same vertical scaling as the Sonus graph.

Regards,
Wayne
My bad, been a while since I used REW. Below is the adjusted scaling. Can see that the response of the highs in each channel is close to the response of both at the same time, just louder.
40467
 
Back
Top