Hello
First post - excellent product and forum. I've searched for 'trim' but without luck.
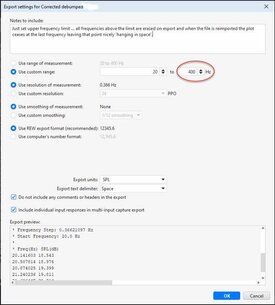
In-box measurements for example after MIB correction, inevitably display unhelpful spl data far above the frequency of interest. Is there a facility in REW to truncate a frequency response at some selected frequency? After truncation, the spl should not drop to zero (which just creates another visual disturbance of the plot screen with a plummeting vertical spl line through other plots), but should just terminate at the final value, leaving that final value as it were 'in the air'?
Example attached - see ugly green MIB curve. If that data was truncated at 200 or 300Hz how much cleaner the display would be!

Many thanks.
First post - excellent product and forum. I've searched for 'trim' but without luck.
In-box measurements for example after MIB correction, inevitably display unhelpful spl data far above the frequency of interest. Is there a facility in REW to truncate a frequency response at some selected frequency? After truncation, the spl should not drop to zero (which just creates another visual disturbance of the plot screen with a plummeting vertical spl line through other plots), but should just terminate at the final value, leaving that final value as it were 'in the air'?
Example attached - see ugly green MIB curve. If that data was truncated at 200 or 300Hz how much cleaner the display would be!
Many thanks.