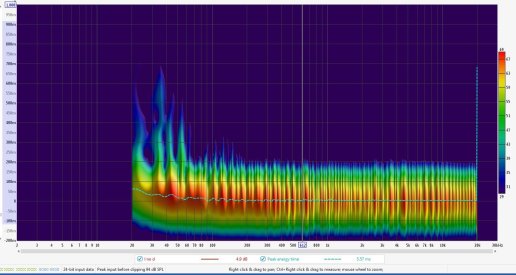
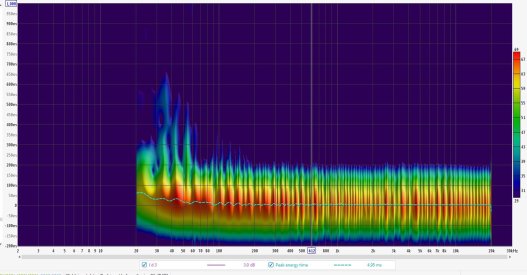
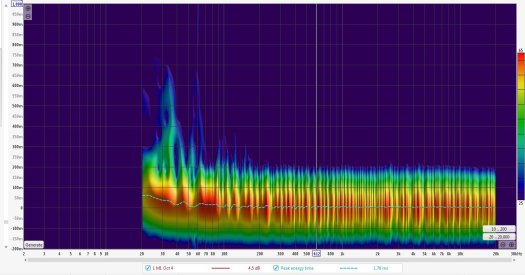
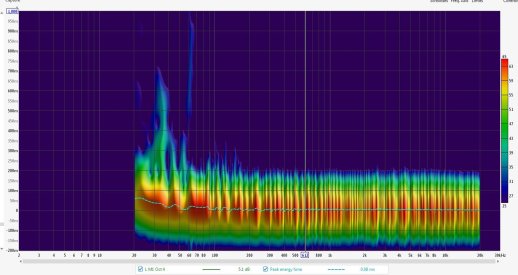
You asked what is causing that spike at 60Hz in your spectrogram.
It is easiest to see what is happening if I make an animate GIF, so I did it for you.
1: No diffuser
2: With diffuser
Now the diffuser does not matter. What matters is the shape of the noise floor. Take note of a few settings I put into REW: (1) time window extended to 1000ms, (2) "Normalize to peak at every frequency" option has been selected, and (3) vertical scale extends to below the noise floor.
Examining bass decay can be quite difficult, in fact I made a
post on ASR about it earlier today. I suggest you take a look at it. In particular, take note of what I said about the lumpy appearance of bass decay. Your measurement is an excellent example of how to recognize a poor signal to noise ratio and how that can apparently make bass decay look worse. Pay particular attention to these:
1. The shape of the lumps changes between measurements. Therefore it is noise and not decay.
2. Some of these lumps are up to -10dB below the measurement and can be easily mistaken for decay. REW does not know the difference, and neither do you ... unless you compare measurements like this.
3. You can see that there is a tone at 60Hz that is unchanged between measurements. Might be a ground loop, might be a fan spinning at 3600rpm (60*60), could be EMI, who knows.