Smoothing the frequency response and phase response graphs

sm52

Member
Thread Starter
Joined
Mar 14, 2019
Messages
882
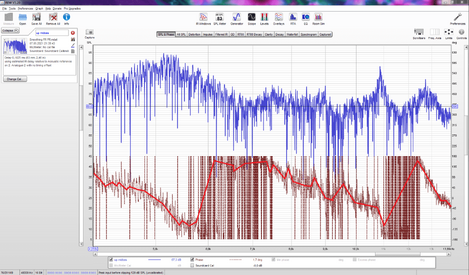
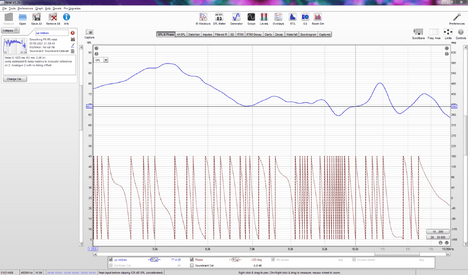
Question to John Mulcahy: When I look at the frequency response graph without smoothing, it is difficult to read. After smoothing 1/48, reads well and looks like it has been squeezed at the top and bottom. That is, it retains all tilts and turns, but is easy to read. The phase response graph before smoothing looks like the frequency response graph, but many vertical lines were placed on top of it. It seems that after smoothing, all vertical lines will be removed and the graph picture will remain, but slightly compressed from above and below. But after smoothing, even 1/48, picture of the graph is lost, disappears, except for the lower frequencies. Is there another smoothing method, after applying which the main picture of the phase response graph would remain, as is the case with the frequency response graph?
With the red curve, I drew the main picture of the phase response graph, which should remain after smoothing.
 

Attachments

  • Up midbas No smoothing.PNG
    Up midbas No smoothing.PNG
    285.3 KB · Views: 52
  • Up midbas Smoothing 1_24.PNG
    Up midbas Smoothing 1_24.PNG
    176.5 KB · Views: 50

John Mulcahy

REW Author
Joined
Apr 3, 2017
Messages
7,296
Where there are strong reflections which cause deep nulls in the response the phase undergoes a 360 degree rotation as it passes through the null. You can see those rotations if you unwrap the phase. Phase has to be unwrapped to smooth it, smoothing does not remove the rotations that were present. To get cleaner phase response you need cleaner measurements, with fewer reflections. Measuring with speaker or driver and microphone as far away from boundaries as possible will help, as will windowing. If the low frequency requirements mean the right hand window cannot be made small enough to exclude all early reflections using a frequency-dependent window can help. The narrower (in cycles) the FDW is the more it will attenuate reflections and their effect on the response, but the stronger the smoothing effect and the lower the resolution.
 

sm52

Member
Thread Starter
Joined
Mar 14, 2019
Messages
882
Or calculate the minimum phase and treat it as the measured phase?
 

John Mulcahy

REW Author
Joined
Apr 3, 2017
Messages
7,296
The generated minimum phase will also be affected by the reflections. Unless you are measuring a single driver the minimum phase may be significantly different than the actual phase, and is also likely to be wrong at the start and end of the frequency range. Better to try and get cleaner measurements.
 

sm52

Member
Thread Starter
Joined
Mar 14, 2019
Messages
882
Yes. Thanks for the clarification. There are a couple of long-standing questions. In order not to create a separate topic, I will ask them here.
1.What does a negative group delay mean physically (what happens to the speaker or driver?) in a certain frequency range?
2. What does a negative step response physically mean (what happens to the speaker or driver?) (when % is selected to display)?
 

John Mulcahy

REW Author
Joined
Apr 3, 2017
Messages
7,296
1.What does a negative group delay mean physically (what happens to the speaker or driver?) in a certain frequency range?
Group delay is the slope of phase negated, negative group delay in a region of the frequency response means phase is increasing with frequency in that region. Rising phase response is generally associated with passing through a dip in the magnitude response. This article has a chart of the correspondence between magnitude and phase response features. I don't understand what you are asking when you say what "physically" happens.
2. What does a negative step response physically mean (what happens to the speaker or driver?) (when % is selected to display)?
What do you mean by "negative step response"? For a driver measurement the step response is roughly reflective of the movement of the driver if its input were a step, positive values are increasing pressure and movements of the cone outwards from its rest position, negative are movements inwards from the rest position. For a loudspeaker with multiple drive units the step response is the sum of the effects of the individual drivers.
 

sm52

Member
Thread Starter
Joined
Mar 14, 2019
Messages
882
The question about step response has now become clearer. Many thanks. On the first question, I will read the article. Later.
 

sm52

Member
Thread Starter
Joined
Mar 14, 2019
Messages
882
I read an article about the phase response of a loudspeaker. Thank you. When I asked about negative group delay, I meant the following. There are two drivers in a common enclosure. If the group delay at the operating frequencies of the woofer is about 5 ms, then the impulse from the woofer comes to the microphone with a delay of 5 ms relative to the tweeter. But there are places on the group delay graph where it goes into negative time values. As I understand it, this may not be due to the fact that the woofer delays the impulse at this frequency more than other frequencies from its range, but because there is a hole in the response of the magnitude. Faithfully?
 

John Mulcahy

REW Author
Joined
Apr 3, 2017
Messages
7,296
You shouldn't use the word "impulse" when you are actually referring to some band of frequencies. Impulse has a very specific meaning, misusing it makes your text confusing. Variations in the phase response slope will result in corresponding variations in the group delay. The group delay shows how the envelopes of signals at different frequencies are delayed. Driver responses within their operating range are generally fairly smooth, so irregularities in the response and corresponding variations in the phase and group delay are likely to be due to the measurement capturing reflections from surfaces along with the direct signal from the driver. You should be careful not to treat response features that are due to the measurement environment as being features of the driver.
 

sm52

Member
Thread Starter
Joined
Mar 14, 2019
Messages
882
Often times, people miss something that builds up the correct chain of explanations in their head. And they say only the beginning and the end, believing that the rest is clear. By the words 'driver delays the impulse' I mean the driver's response to a series of electrical signals in the form of sound waves generated by this driver, reaching the microphone.
But the main thing is to avoid reflections. I understood it.
Which graph shows the delay of one driver relative to another more accurately - group delay or excess group delay? This is in order to calculate the distance that it is necessary to move one driver relative to the other in order to align them in time.
 
Top Bottom