Flexifools
Registered
Thread Starter
- Joined
- Nov 8, 2023
- Posts
- 3
Hi
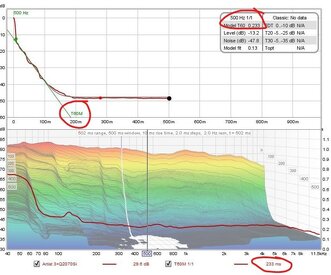
I have just started using REW so am pretty new. I have got most of the basics however when using RT60 decay it seems a bit odd...
So you add the calculate RT60 Model from the controls which creates a straight line on the graph as to where the signal will decay 60DB. however in 2 other places on the chart it has the model T60 which shows a different number.
I did check the help files but they did not suggest an obvious difference.
Can someone shed some light on why they are different and which one should be used for room measurements?
Picture attached with the different values circled
thanks
Andy