REW vs ARTA RTA

klacika71

Registered
Thread Starter
Joined
Jul 8, 2019
Messages
5
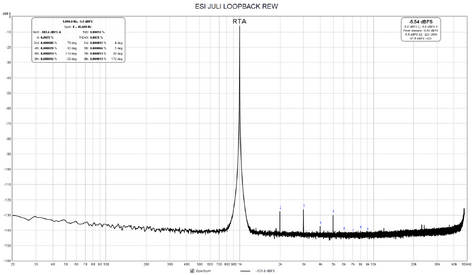
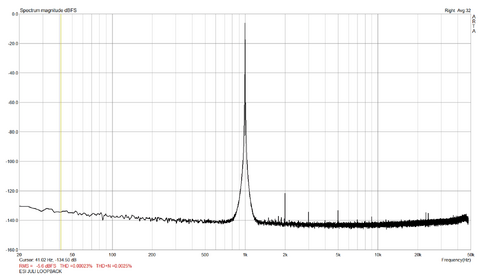
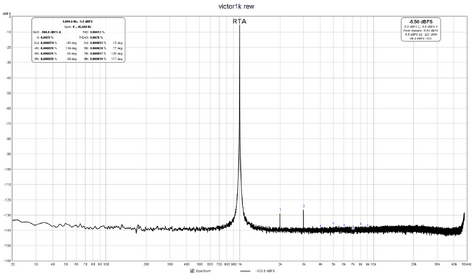
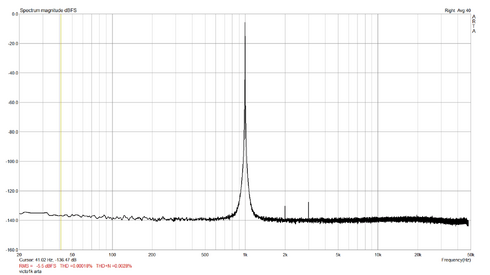
Hi all , for years I used ARTA for distortion measurements. REW looks better, but when I compare RTA results, REW measures lower distortion level than ARTA (the harmonics are different also).
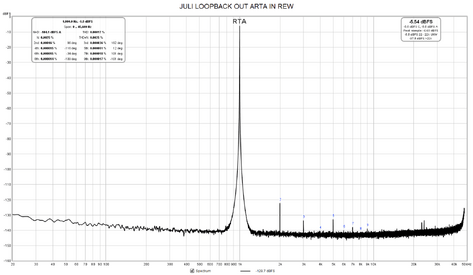
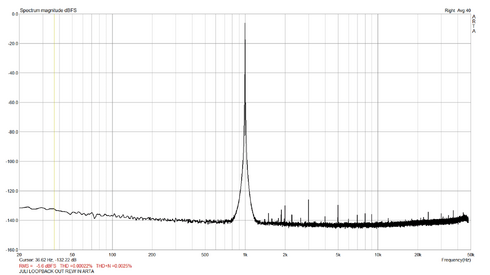
Which system is more accurate ? What did I do wrong ?

OS WIN7 64bit
ESI JULI PCI LOOPBACK
DRIVER ASIO4ALL v2.14
ARTA 1.9.1
REW v5.20 b17
FS 96k, FFT 64k, Hanning
 

Attachments

  • ESI JULI LOOPBACK REW.png
    ESI JULI LOOPBACK REW.png
    50.3 KB · Views: 155
  • ESI JULI LOOPBACK ARTA.png
    ESI JULI LOOPBACK ARTA.png
    31.3 KB · Views: 154

John Mulcahy

REW Author
Joined
Apr 3, 2017
Messages
7,212
Make sure the levels are the same in both cases, dBFS can mean different things depending on whether it is the AES definition (where full scale sine rms is 0 dBFS) or the mathematical definition (where full scale sine rms is -3.01 dBFS). I think ARTA uses the AES definition, in REW the choice depends on the setting of the "Full scale sine rms is 0 dBFS" view preference. Also make sure the card is configured to operate at the chosen sample rate in the Windows audio settings as well as in REW, to avoid OS resampling.
 

klacika71

Registered
Thread Starter
Joined
Jul 8, 2019
Messages
5
The system (PC,OS,SOUND CARD,DRIVER) is the same. I just checked the generator output level with DMM, in both cases (ARTA,REW) show 1.179Vrms. "Full scale sine rms is 0 dBFS" is checked. In other system (WIN10, X-Fi USB) I also observed the same, REW measured ca the half THD.
 

John Mulcahy

REW Author
Joined
Apr 3, 2017
Messages
7,212
It is pretty easy to check REW's result, since the generator can add any distortion you like. Here is a digital loopback (albeit through a sample rate converter) where I have added a 2nd harmonic at -120 dB in the generator, which is detected as -120.0 dB in the RTA. The THD figure will depend on the number of harmonics included, for REW that is 9 (or as many as fit in the sampling bandwidth if fewer), not sure how many ARTA includes, perhaps all within the bandwidth.

24047
 

klacika71

Registered
Thread Starter
Joined
Jul 8, 2019
Messages
5
I made an experiment, crosslinked the two systems.
OUT:ARTA, IN:REW
OUT:REW,IN:ARTA
Can you recognize something from these two graphs ?
 

Attachments

  • JULI LOOPBACK OUT ARTA IN REW.png
    JULI LOOPBACK OUT ARTA IN REW.png
    51 KB · Views: 77
  • JULI LOOPBACK OUT REW IN ARTA.png
    JULI LOOPBACK OUT REW IN ARTA.png
    32.3 KB · Views: 79

John Mulcahy

REW Author
Joined
Apr 3, 2017
Messages
7,212
When ARTA is the output the spectrum plots for REW and ARTA look the same to me, other than the rise in the noise floor at close to 48 kHz in the REW spectrum. Both show quite a high 2nd harmonic so that seems to be a feature of the ARTA generator output. It is by far the most dominant feature in the spectrum so is the main determinant of the THD figure.

When REW is the output the spectrum plots also look quite similar, with much lower 2nd harmonic though raised 3rd harmonic, but there are extra inharmonic spikes in the ARTA plot.

I'm a little surprised the ARTA THD figure is almost the same for both generators, 0.00023% / 0.00022%, considering how much difference there is in the 2nd harmonic level. Both look high. The width of the main peak might be a factor in the ARTA reading, a different choice of window might help that.
 

klacika71

Registered
Thread Starter
Joined
Jul 8, 2019
Messages
5
external generator (victor1k) at -5.5dBFS, they are pretty close
 

Attachments

  • victor1k rew.png
    victor1k rew.png
    45.8 KB · Views: 64
  • victor1k arta.png
    victor1k arta.png
    29.3 KB · Views: 63
Last edited:

John Mulcahy

REW Author
Joined
Apr 3, 2017
Messages
7,212
Try using the REW generator with the option to Lock frequency to RTA FFT selected, that will use a frequency that is periodic in the FFT length and remove the window spreading of the fundamental.
 
Top Bottom