Real artefacts or measurement artefacts

dch53

Registered
Thread Starter
Joined
Feb 15, 2019
Messages
22
Hi,

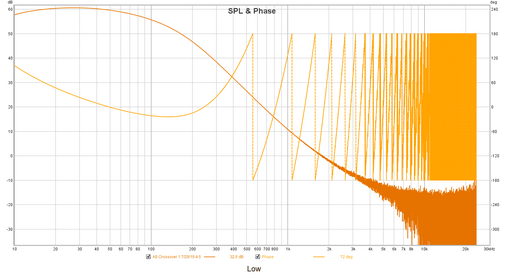
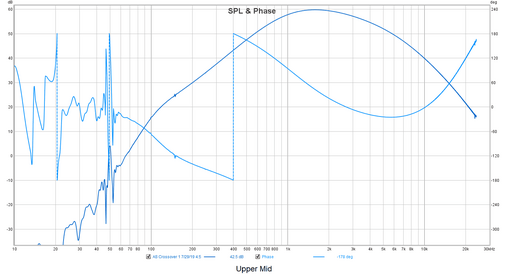
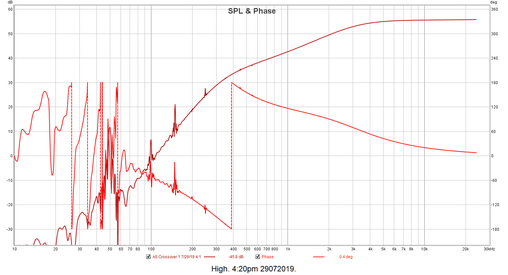
I'm using REW V5.20 Beta 17 to test some tube crossovers. The passband responses look OK but the out-of-band SPL and phase contain lots of spurious excursions.

I've attached some examples. I need to know whether they're indicative of a problem or just measurement artifacts.

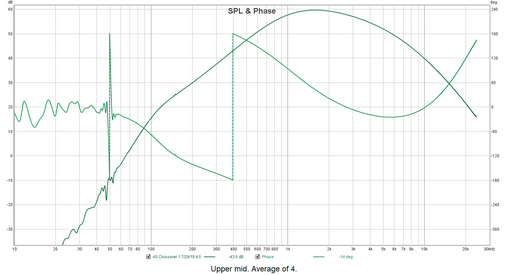
Low.png Upper Mid.png High.png Upper mid, average of 4.png

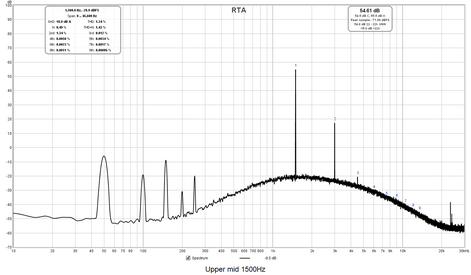
The last one is an average of 4 sweeps. It looks a lot better. What disturbance there is is at the 50Hz mains frequency so I'm guessing that interference has something to do with it. The 1500Hz spectrum suggests that's the case:

Upper Mid 1500Hz.png

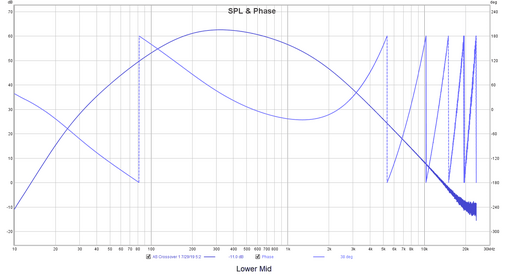
The lower mid actually looks pretty good apart from the large out-of-band phase changes:

Lower Mid.png

Any suggestions for improving the frequency and phase responses please? More averages?

Thanks, Dave.
 

John Mulcahy

REW Author
Joined
Apr 3, 2017
Messages
7,212
Main issue is picking up mains and mains harmonics, other than that measurements look OK. Phase responses will be very dependent on your timing reference and anything that has been done to remove time delays from the measurements. Probably easier to post the mdat file for the measurements than the images.
 

dch53

Registered
Thread Starter
Joined
Feb 15, 2019
Messages
22
Thanks very much John.

Here are the 4 mdat files. Apart from the hash (which I didn't have when I did the original measurements a few months ago) I obviously have some work to do correcting the crossover points (supposed to be 35Hz, 35Hz to 125Hz, 125Hz to 14kHz and 14kHz. The slopes should all be 18dB and some aren't too.

I'm familiar with the axis zoom buttons and the use of the Limits dialog (which sometimes doesn't seem to do what I want it to do; for example I enter 10Hz for the lower frequency limit and the lower frequency limit doesn't change) but is there some sort of "zoom to fit" facility?

I've noticed that when I when I select Preferences from the Preferences menu the Preferences dialog opens behind the main window. When I type ctrl-shift-E it opens in front. I don't think that behavior was there in earlier betas but I could be wrong.

Finally, could you please explain "Phase responses will be very dependent on your timing reference and anything that has been done to remove time delays from the measurements"? I'm simply driving my Juli@ card from REW and outputting the signal through an interface to the unit under test.
 

Attachments

  • Bass.mdat
    1.9 MB · Views: 6
  • High.mdat
    2.3 MB · Views: 6
  • Lower Mid.mdat
    1.9 MB · Views: 6
  • Upper Mid.mdat
    2.3 MB · Views: 6

John Mulcahy

REW Author
Joined
Apr 3, 2017
Messages
7,212
I'm familiar with the axis zoom buttons and the use of the Limits dialog (which sometimes doesn't seem to do what I want it to do; for example I enter 10Hz for the lower frequency limit and the lower frequency limit doesn't change) but is there some sort of "zoom to fit" facility?
When did you find that entering 10 Hz did not work? Which graph?

You can select an area on the graph by pressing the Ctrl key and dragging with the right mouse button pressed, clicking in the resulting highlighted area will fit the graph to that area.

I've noticed that when I when I select Preferences from the Preferences menu the Preferences dialog opens behind the main window. When I type ctrl-shift-E it opens in front. I don't think that behavior was there in earlier betas but I could be wrong.
That's a side effect of trying to make sure menus remain visible even if an always-on-top window is in front of them I hadn't experienced the dialog behind problem as I tend to use the shortcuts or the toolbar buttons. I'll disable the workaround since the cure is worse than the original problem for that one.

Finally, could you please explain "Phase responses will be very dependent on your timing reference and anything that has been done to remove time delays from the measurements"? I'm simply driving my Juli@ card from REW and outputting the signal through an interface to the unit under test.
Phase is wholly dependent on where in the impulse response is defined as being t=0. Your measurements are made without a timing reference, so t=0 is being assigned to the peak of the response. That is OK for full range responses, but for something with a limited frequency range the peak will occur later. Let's take the bass measurement as an example, this is the impulse response with the t=0 point set as the peak:

23690


The response actually starts earlier though, at about -2.5 ms. REW can make a good estimate of where t=0 should be using the Estimate IR delay button or the Set t=0 at IR start button, but there is a glitch in the response and some offset which will interfere with those processes (the glitch shouldn't be there, perhaps a result of the mains interference you are getting). Placing t=0 where the response looks like it should start gives this phase response, which looks more reasonable:

23691


The group delay plot of the original measurement, with some smoothing to clean up the noise, tells the same story. Group delay is levelling out at -2.5 ms beyond the pass band of the driver which tells us there is 2.5 ms of delay in the response, shifting t=0 corrects that and moves the group delay back to zero in that region.

23692


As you are making electronic measurements a loopback connection on another soundcard channel could be used as a timing reference to set the t=0 point automatically.
 

dch53

Registered
Thread Starter
Joined
Feb 15, 2019
Messages
22
When did you find that entering 10 Hz did not work? Which graph?

As you are making electronic measurements a loopback connection on another soundcard channel could be used as a timing reference to set the t=0 point automatically.

Thanks very much for this John. This is an amazing piece of software!

40 years since I did this sort of stuff at university and never used it since so I obviously only know enough to be dangerous.

I was trying to set 10Hz as the lower limit in the SPL & Phase graph after clicking the "20 .. 20,000" button at bottom left. I'm not able to replicate it right now but if it happens again I'll let you know.

I was able to reproduce your impulse response graph and shift t=0 to where the response looks like it starts to match your phase response. I'll have to read up on reducing noise in the GD graph though. My graph is completely red beyond about 500Hz.

To use the loopback connection on the other soundcard channel as a timing reference to set the t=0 point automatically I assume I select the appropriate channel in the drop down under "Timing Reference Output" in soundcard preferences.
 

dch53

Registered
Thread Starter
Joined
Feb 15, 2019
Messages
22
Hi John,

I reran all the measurements with "use loopback as timing reference" and a -40dBFS level instead of -55dBFS. The results are attached.
  • The Bass SPL & Phase looks very good.
  • The Lower mid looks better but I had to tweek it.
  • The Upper mid looked good anyway but the phase shifts in the pass-band have moved.
  • The High still looks terrible and I couldn't improve it.
A couple of questions:
  1. Are the phase changes in the pass-band actually there? I suppose I could check that with my oscilloscope.
  2. Why is the high pass filter showing all the SPL noise but not the others? Maybe at 60dB down it's not an issue for the other filters.
What I'm trying to do here is separate measurement artifacts from those that I need to fix like the crossover points and a couple of the slopes.

Thanks very much for your help.
 

Attachments

  • Bass 300719 with level set to -40dB and loopback as time reference.mdat
    2.9 MB · Views: 7
  • High 310719 -40dB loopback as timing reference.mdat
    2.9 MB · Views: 5
  • Lower Mid 310719 with loopback as time reference.mdat
    2.9 MB · Views: 5
  • Upper Mid 310719 40dB loopback as timing reference.mdat
    2.9 MB · Views: 5

John Mulcahy

REW Author
Joined
Apr 3, 2017
Messages
7,212
Loopback looks to be working well. -40 dBFS is still a very low test signal level, which won't be helping with the noise pickup. That is especially the case for the high measurement since there is no output at low frequencies to hide the noise. You can clean up the measurements a little by applying some smoothing (see the Graph menu or the controls in the All SPL graph). Even applying just 1/48th octave smoothing to all the traces cleans things up quite a bit.

By phase change in the pass band are you referring to the wrap in the upper mid? The upper mid is inverting, so phase is around -180/180 in the middle of its pass band. Outside the pass band all the measurements will be noisy in magnitude and phase.
 

dch53

Registered
Thread Starter
Joined
Feb 15, 2019
Messages
22
Thanks again John. -40dBFS gives me around 100mV out of the crossover. -20dBFS gives me around 800mV.I'll try running all the measurements at -30dBFS.

The 1/48th octave smoothing does indeed do an excellent job.
 
Top Bottom