MSO - Multi-Sub Optomizer

JStewart

Senior AV Addict
Supporter
Thread Starter
Joined
Dec 5, 2017
Posts
2,573
Location
Central FL
Sharing my experience with MSO for anyone not familiar with it. More information can be found at the authors website http://andyc.diy-audio-engineering.org/mso/html/
There's also a support thread started by AndyC the author/creator on AVS forum which is a pretty good read. The purpose of the program is to reduce seat to seat variation in the base frequencies and, if you want to or can with your set-up, integrate either mains or center with subs.

Like me, you may find the program has a bit of a learning curve to use effectively, but I thought it time well spent in pursuit of better bass. Also to use the program you'll need a dsp capable of handling PEQ filters, delays, and gains, in my case miniDSP 2x4HD, REW, a calibrated mic, and the ability to take measurements with either a loopback or acoustic reference.

I got to playing with it, (my idea of fun i guess) when a post hurricane Irma brown out fried by living room receiver. I had 2 SVS PB-2000 in the main room for music and movie watching (I have a hard time calling it a theater because of its size. 12.5'L x 11'W x 10'H. Maybe HTIB?) and while I and others have found it to work with two subs, Andy C recommends 3 or more. So I pulled the cheap $100 10" sub out of the living room and put it in there with the 2 SVS.

Next, take measurements with REW. Export the data from REW to txt file. Import to MSO. Configure MSO for your situation and then let MSO spend an hr or so trying to figure out the best combo of gains, delays, and PEQ filters to attain the goal of matching the response at each of your seats. In my case, the 3 seats on the sofa.

So for example here's the raw data for the left sub (Sub 1) by itself at each seat (Position). You can see how much variability there is from on seat to the next as well as the horrible response normally found in small rooms. The sofa is 89" accros. So about 26" - 28" between measurements positions. The graph is unsmoothed.
Sub1%20At%20Each%20Seat.png


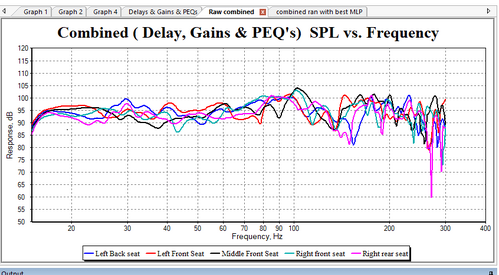
Now after MSO has done its magic and the MSO filters have been exported and imported into the miniDSP along with setting MSO's recommended gains and delays I redid the measurements in REW to confirm MSO's anticipated results. Again the graph is unsmoothed. And it shows the response at each seat with the 3 subs being used.
After%20MSO%20No%20Smoothing.png

There is a range of 2db for each seat (No Smoothing). One seat (the read one, typical one for movie watching) has about 1.5db higher spl in this range. Pretty cool indeed. Its also possible to adjust to a house curve.

So the cheap subwoofer is back in the living room and I've added a Rythmik L12 to the room permanently (or at least for now!)
 
Wow, that’s pretty impressive, great news for those unfortunate people stuck in the dreaded “shoebox” rooms. I’ve always been fortunate enough to have my system in “open-concept” family rooms with cathedral ceilings and the like, but once we buy a new house and move I may not be that lucky again.

I assume much of the correction was simple delay-based? Because there’s no way you could EQ those 50+ dB deviations into submission...

Regards,
Wayne
 
I assume much of the correction was simple delay-based? Because there’s no way you could EQ those 50+ dB deviations into submission...
Is "deviation" another way of saying deep nulls? Ha!
Should have mentioned there were no filters with gains used. Delays were used but none greater than 2.5ms and the volume of 1 sub reduced by 2db. 3 subs in shoebox still left me with plenty of headroom.
To expand further, the program will allow an optimization using only delays, only gains, only filters, or any combination of the three.
 
Would this work with a Behringer Feedback Destroyer 1124?
 
Should have mentioned there were no filters with gains used.
Doesn’t matter. Boosting or cutting is largely academic. Deviations that large are beyond the help of any equalization, even with only negative-gain filters, so the delay must have done most of the “work” with the EQ providing “clean-up.”

Regards,
Wayne
 
Last edited:
Would this work with a Behringer Feedback Destroyer 1124?
AFAIK The BFD doesn't have any delay adjustments, so it wouldn't work. The Yamaha YDP2006 probably would, though.

Regards,
Wayne
 
I assume much of the correction was simple delay-based? Because there’s no way you could EQ those 50+ dB deviations into submission...

Some of it is delay-based. But also there are different PEQs for each sub. This means that the relative phase between the subs at any listening position depends not only on the delay difference in the DSP, but also the phase difference caused by each sub having different PEQ parameters than the others.

It's been said that having different PEQs for each sub in order to flatten the response of each sub individually is the wrong approach. That's true. But MSO computes the combined outputs of all subs at each listening position and minimizes a composite frequency response error that takes into account all the listening positions. It's a form of mode manipulation that's capable of reducing the seat-to-seat variation of the frequency response in addition to improving its flatness. There's more info about that in the first page of the tutorial.
 
Hi Todd, does the BFD have separate inputs for 2 subs? MSO will allow delays on 1 channel less than the number of subs you have so with 2 subs you get 1 delay, 3 subs 2 delays, etc. So I was thinking if the BFD had two inputs then you could use the delays for your two outputs on your Yamaha with the sub configuration set to mono. In this example a 3 sub configuration would have delays for 2 subs but only filters for 2 subs.
The other watch out I can think of is not all PEQ filters are designed with the same convention. I'd guess that's one of reasons REW allows you to pick your device when generating PEQ filters. So that may or may not be a problem with the BFD. Either John Mulcahy or AndyC could probably answer that question.
If you had a mind to just try MSO out you can still use it just to see what delays or gains or filters it would recommend. In my case MSO's predicted spl graph was accurate when checked with REW.
 
MSO will allow delays on 1 channel less than the number of subs you have so with 2 subs you get 1 delay, 3 subs 2 delays, etc.

There's two sets of rules that apply regarding the number of allowable delays. For sub-only configurations (in which MSO is not being used to integrate mains and subs), the number of allowable delays is one less than the number of subs. For sub+main configurations, the number of allowable delays is the same as the number of subs. In the latter case, the extra degree of freedom is used to optimize the integration of mains and subs.
 
Hey Andy, Thanks for coming on over to AV NIRVANA, glad to see you supporting MSO here. It really is a great product (even if not everyone appreciated what it does well).
 
Hey Andy, Thanks for coming on over to AV NIRVANA, glad to see you supporting MSO here. It really is a great product (even if not everyone appreciated what it does well).

Thanks. I hesitate to use the word "support" for my "product" LOL. I think "help" might be a better description. Some people need to be guided each and every step of the way, but that's too big of a burden to take on.
 
Last edited:
Thanks. I hesitate to use the word "support" for my "product" LOL. I think "help" might be a better description. Some people need to be guided each and every step of the way, but that's too big of a burden to take on.

Hah, Ok well, thanks for stopping by, I hope you stick around. Your software is a great asset to the more advanced home theater enthusiast.
 
Yes indeed.
t.gif


Regards,
Wayne
 
I give a big thumbs up to MSO! I've used it to great effect in my room. Definitely a bit of a learning curve that may include tossing out some work and starting over again(not that this happened to me...:tongue:). So I do suggest to RTFM :reading: thoroughly :T.

I'm not aware of any other solution out there, aside from the very costly Harman's SFM, that reduces seat to seat variance.

Thanks Andy!:hail:
 
Last edited:
Hah, Ok well, thanks for stopping by, I hope you stick around. Your software is a great asset to the more advanced home theater enthusiast.

I have the thread on watch, so if general questions come up I'll give a shot at answering them.

Edit: I added a "Before You Begin" section to the main page, which is a pretty long list, to try to preemptively cover many questions that have come up.
 
Last edited:
Good day, all. I'm looking for some suggestions on how to add a house curve to my MSO results. The flatness of the curve is and the seat to seat consistency is much improved, however, I'd like to add a little more punch to the lower bass frequencies and was told that addition of a house curve could do that. Has anyone done it and would care to comment? I have included a zip file of my MSO run for reference. As for the room and the equipment being used, here is a list:
HT Room:18'x13'x7.5' with 2 rows of seating.
Pioneer SC-99 & Audiosource AD1002 for Atmos & DTS:X 7.2.4
Andrew Jones Pioneer Elite SP-EFS73 Mains, SP-EC73 Center, SP-EBS73-LR Rear Surrounds, SP-BS41-LR Side Surrounds & Dual SVS SB12-NSD Subs with MiniDSP 2x4 Tuned with REW and MSO.


Thanks in advance.
 

Attachments

Good day, all. I'm looking for some suggestions on how to add a house curve to my MSO results. The flatness of the curve is and the seat to seat consistency is much improved, however, I'd like to add a little more punch to the lower bass frequencies and was told that addition of a house curve could do that. Has anyone done it and would care to comment?

There's a large amount of subjectivity when it comes to house curve preference and the process to load - optimize - load filters - listen with MSO is not quick for experimentation to see what sounds good to you. Faster would be to apply filters (a shelf filter in particular) to the input channel of the MiniDSP. You can do it on the fly. Very quick. You can set up a "shared filter" under the "Subwoofer Channels" of MSO and manually apply a filter (or filters) to see what the result would look like on your configuration measurement groups graph.

If you'd like to experiment with MSO applying the curve, I've attached text file that has a curve with a 6.5 dB rise from 400hz to 20hz that is freely available to Dirac room correction users, and which I've modified to load to MSO. It's supposed to be in line with recommendations from Harman and is generally in line with NAD's room feel curve.
 

Attachments

There's a large amount of subjectivity when it comes to house curve preference and the process to load - optimize - load filters - listen with MSO is not quick for experimentation to see what sounds good to you. Faster would be to apply filters (a shelf filter in particular) to the input channel of the MiniDSP. You can do it on the fly. Very quick. You can set up a "shared filter" under the "Subwoofer Channels" of MSO and manually apply a filter (or filters) to see what the result would look like on your configuration measurement groups graph.

If you'd like to experiment with MSO applying the curve, I've attached text file that has a curve with a 6.5 dB rise from 400hz to 20hz that is freely available to Dirac room correction users, and which I've modified to load to MSO. It's supposed to be in line with recommendations from Harman and is generally in line with NAD's room feel curve.

Thank you for the guidance, much appreciated. I will try this today and report back.
 
...If you'd like to experiment with MSO applying the curve said:
Question about this. Do you leave the 2 options listed under Target Curve, checked or unchecked?
 
You're referring to the 2 check boxes for interpolation of the target curves? Beyond the literal explanation in the windows tool tip popup I don't have have any info either and I would think users must check only one or the other. When I tried using a target curve that is what I (intuitively?) did. This is only my best guess though and if correct it would indicate the first bug in the program I've seen in that it will also allow selection of neither or both. Logically you can't calculate the target curve both ways at the same time I would think. Also interestingly no combination of choices cause a crash when optimizing a configuration.
Also possible something's changed in a subsequent version. I'm using version 1.26.
 
Log interpolation was originally put there for cases in which a text editor is used to generate the target curve manually. For example, Geddes recommends a target curve that just looks like a tilted line on a log frequency scale. If I recall correctly, he mentioned a 6 dB per decade slope from 20 Hz to 200 Hz in his multi-sub video. In that case, using log interpolation (only), a text file of such a target curve would require that only two points be entered. It would look like this.

20.0 6.0
200.0 0.0

Cubic spline interpolation might be used when using a text editor to specify a curve with, say, four or five points, but you want a smooth curve between them, in which the slope of the curve on the left and right side of each point is the same (the first derivative is continuous). Here you would probably want to use log interpolation as well, for best appearance of the curve when displayed on a log frequency axis.

At any rate, you can plot what your target curve looks like when a fine frequency spacing is "filled in" using the interpolation, as target curves are a bona fide trace type in MSO.

The other way to generate a target curve is a workaround I made up involving saving the response of a shelving filter. This is described in the Target Curve Property Page documentation and makes use of the target curve example project.

When exporting the response of a shelving filter to create a target curve, the interpolation you use upon import won't make much difference, as the file will have many frequency points. I just use a combination of log and cubic spline interpolation for the smoothest curve, but this isn't really necessary.
 
You're referring to the 2 check boxes for interpolation of the target curves? Beyond the literal explanation in the windows tool tip popup I don't have have any info either and I would think users must check only one or the other. When I tried using a target curve that is what I (intuitively?) did. This is only my best guess though and if correct it would indicate the first bug in the program I've seen in that it will also allow selection of neither or both. Logically you can't calculate the target curve both ways at the same time I would think. Also interestingly no combination of choices cause a crash when optimizing a configuration.
Also possible something's changed in a subsequent version. I'm using version 1.26.

Yes! I've tried with each one check individually, as well as with none of them checked. Seems like regardless of which I use, the results after running MSO for 30 minutes are much worse than when I don't use a target curve. By worse, I am referring to the results showing bigger nulls and peaks, and the db difference from listening position increasing to 15db or more at some frequencies. I'll have to study what you originally suggest with regards to adding a shelf filter in the MiniDSP, but I'm not familiar with the process so I would be lying if I said I knew what I was doing. :justdontknow:

Alternatively, there is a section in the MSO manual that mentioned something about imputing two values (one high and one low) and allowing the software to interpolate the difference. Not sure if that's the purpose of having the options there, to begin with, but I'll look into that also.
 
Log interpolation was originally put there for cases in which a text editor is used to generate the target curve manually. For example, Geddes recommends a target curve that just looks like a tilted line on a log frequency scale. If I recall correctly, he mentioned a 6 dB per decade slope from 20 Hz to 200 Hz in his multi-sub video. In that case, using log interpolation (only), a text file of such a target curve would require that only two points be entered. It would look like this.

20.0 6.0
200.0 0.0

Cubic spline interpolation might be used when using a text editor to specify a curve with, say, four or five points, but you want a smooth curve between them, in which the slope of the curve on the left and right side of each point is the same (the first derivative is continuous). Here you would probably want to use log interpolation as well, for best appearance of the curve when displayed on a log frequency axis.

At any rate, you can plot what your target curve looks like when a fine frequency spacing is "filled in" using the interpolation, as target curves are a bona fide trace type in MSO.

The other way to generate a target curve is a workaround I made up involving saving the response of a shelving filter. This is described in the Target Curve Property Page documentation and makes use of the target curve example project.

When exporting the response of a shelving filter to create a target curve, the interpolation you use upon import won't make much difference, as the file will have many frequency points. I just use a combination of log and cubic spline interpolation for the smoothest curve, but this isn't really necessary.

Hi Andy,

Thanks for chiming in. I saw your post after I had already replied, but based on your reply, it looks like my hunch was correct. I will do another run with your suggested two points. I've attached a picture of the results that I want to add the Target Curve onto. in the pic, the Left Front Seat is my MLP.

The measurements were taken with the mains individually and the subs individually per your MSO instructions. I used the Left Main channel to energize each sub.
The total system is 7.2.4 Dolby Atmos/ DTS:X setup, with 2 rows of seating.

With regards to the suggested range for interpolation, is the 20-200 range what you would recommend for my results? Currently, the AVR is set up with all speakers as small and a crossover at 80hz.
 

Attachments

  • combined.png
    combined.png
    15 KB · Views: 95
I had a chance to download your MSO project and try the target curve with your data.

This is the best result so far and looks in line with the example for using two subs @andyc56 provides in the Tips and Tricks section of his documentation.

Original optimized configuration:
2018-12-24.png

Optimized configuration with target curve:
2018-12-24 (1).png


Hope it helps.
 

Attachments

Back
Top