Loopback frequency response plot off by one order of magnitude

sekim

Registered
Thread Starter
Joined
Mar 23, 2021
Messages
9
First order high pass filter device with 2.6K cutoff frequency was measured by analog oscilloscope and by RMAA software in loopback mode and both methods confirm 2.6K cutoff.

REW (5.20 rc9) plots the same device as having a 260 Hz cutoff frequency when using the loopback calibration mode (using dB full scale).
 

John Mulcahy

REW Author
Joined
Apr 3, 2017
Messages
7,357
There isn't a loopback calibration mode for measuring. A loopback calibration of measurement output to measurement input can be used to compensate for the measurement system roll-offs. When measuring there is a loopback timing reference option to establish the t=0 position for the measurement. For your filter measurement it is probably easiest to attach the mdat file for us to look at.
 

sekim

Registered
Thread Starter
Joined
Mar 23, 2021
Messages
9
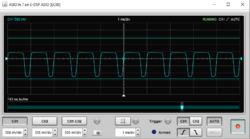
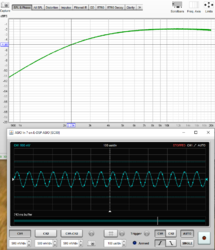
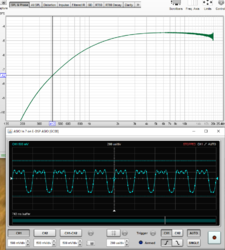
My apologies, I'm relatively new to your software and was going off a YouTube where they explained how they used your software to measure a device patched in loopback. They used your soundcard calibration feature, which seems ideal with is wizard workflow and the fact the only need is for a sine sweep frequency response plot. The issue I encountered can be reproduced by doing Preferences>Soundcard>Calibrate soundcard>Next>Next>Next>Next and then on SPL & Phase tab select dBFS for left axis for the plot (of course after patching in a device to test). But if there is a better way to do this, I'll try it out. All of that said, the graph generated by the above workflow appears fine except that the frequency values are low by a factor of 10 compared to analog oscilloscope and RMAA. I would think its still an issue even using this feature only for its intended purpose of creating a soundcard compensation profile.

I read the help file for the loopback timing reference feature you mentioned and what I'm getting out of that is it seems to be for aligning an IR that can be generated. Again, my apologies for stumbling thru this since I'm pretty new to your product. If that is what its for, I don't need an IR of the response (though that does give me some cool ideas), all I need is a sine sweep plot to validate a piece of hardware. (for anyone following this thread and guessing the 1st order high pass with 2.6KHz cutoff is a Dallas Rangemaster, you'd be right :-))

Thanks for your help and let me know if I can provide anything to assist. You mention mdat file, I'll go read the help and see if I can come up with it for you if its still needed after my hopefully more understandable explanation.
 

John Mulcahy

REW Author
Joined
Apr 3, 2017
Messages
7,357
Soundcard calibration makes a measurement, though it expects what it is measuring to be a loopback from output to input so that a calibration file can be generated from it. Difficult to imagine how it could be made to shift frequencies, but saving the resulting measurement (which generates an mdat file) and attaching it will provide something to examine.
 

sekim

Registered
Thread Starter
Joined
Mar 23, 2021
Messages
9
Soundcard calibration makes a measurement, though it expects what it is measuring to be a loopback from output to input so that a calibration file can be generated from it. Difficult to imagine how it could be made to shift frequencies, but saving the resulting measurement (which generates an mdat file) and attaching it will provide something to examine.

OK, after digging in a lot deeper I discovered that the sine sweep result varies quite a bit based on the distortion % seen at the device output. But then the feature is "soundcard calibration" and even the cheapest soundcards will have at least an order of magnitude less distortion than a Rangemaster at even miniscule input levels.

I figured out the puzzle when I went back to RMAA (which unfortunately refuses to run on my primary workstation and appears is no longer being developed) and tried its sine sweep method (as opposed to multitone method) and also got odd results. Once I adjusted IO levels so that the distortion seen at the Rangemaster output was lower the results began to appear as expected. That was not the case with REW but results were much closer, within about 1KHz, which brings us back to the fact its a "soundcard calibration feature" where virtually no distortion is expected :)

So my only question at this point is does REW have a feature more appropriate for my use case? If not, I'm not asking for it unless you get really bored and just want something to do, lol.

EDIT: I also tested a very clean 1st order filter with extremely low distortion and can confirm that REW soundcard calibration agrees with RMAA for this piece of hardware.
 
Last edited:

John Mulcahy

REW Author
Joined
Apr 3, 2017
Messages
7,357
Your use case being to measure something? Just use the Measure button. Log sweep measurements are very tolerant of harmonic distortion, it is rejected as part of the process, so I'm a bit dubious of your explanation.
 

sekim

Registered
Thread Starter
Joined
Mar 23, 2021
Messages
9
Using the Measure button gives me these results for testing the Rangemaster. As can be seen in the attachment labeled Clean, when input to the Rangemaster is low and it outputs a somewhat clean sine and makeup gain is used the frequency plot shows ~2.23KHz cutoff which is fairly close the the 2.6KHz -3dB cutoff as measured with analog equipment.

In the attachment labeled Distorted, we see that the waveform displays both analog distortion and digital distortion, the waveform at that frequency/input level appears on analog oscilloscope as seen in the attachment labeled "Actual" (which is @ 1KHz where the digital distortion does not occur). As can be seen in the plot, the -3dB cutoff is reported as ~412Hz.

I cannot speculate the root cause(s) for the differences, only provide the empirical findings that show the correlations. I'd be happy to do other tests if that is useful, but I'm fine just doing this sort of testing on analog gear...
 

Attachments

  • Actual.PNG
    Actual.PNG
    12.5 KB · Views: 17
  • Clean.PNG
    Clean.PNG
    32.1 KB · Views: 21
  • Distorted.PNG
    Distorted.PNG
    30.8 KB · Views: 21

sekim

Registered
Thread Starter
Joined
Mar 23, 2021
Messages
9
Actually they're not very close with respect to what the filter sounds like. The parts for the filter section were hand selected to produce a 2.6KHz cutoff. The device measures right on 2.6KHz with analog gear. It also measures right on 2.6KHz cutoff using RMAA multitone method but not with its sine sweep method (when too distorted). As a guitarist, I can assure you there is a substantial difference in what one of these sounds like with a 2.6KHz cutoff and what it sounds like with an actual 2.23KHz cutoff that REW indicated for a somewhat clean sine. Which is precisely why boutique models often include switches to change the capacitor value of the filter. As I stated in the post earlier, I'm fine just measuring this sort of thing with analog gear. It doesn't matter how much distortion is present, it'll come up with the right answer, its just more effort to do it that way is all, plus no nice plot.
 
Last edited:

John Mulcahy

REW Author
Joined
Apr 3, 2017
Messages
7,357
It isn't really meaningful to try and determine a filter cutoff frequency on a signal that is subject to heavy compression since the reference level for the -3 dB point is determined by the action of the compressor rather than the filter. To measure the filter you will need to stay out of the range of the compressor.
 

sekim

Registered
Thread Starter
Joined
Mar 23, 2021
Messages
9
There is no compressor. The circuit is about as dirt simple as it gets. Its a single class A transistor with a single capacitor on the base that functions as a first order filter in conjunction with the bias resistors and the impedance of the transistor. The caveat is that the bias point is intentionally set to produce asymmetric distortion. But I get what you're saying. In this case the distortion, being asymmetric, is functioning as a sort of half wave compressor once the signal is strong enough to take the transistor into to the affected rail. And of course lowering the input to the device gets us closer to a clean sine at device output (if you call ~8% THD "clean" lol) and the measurement is much closer.

Bottom line is I'm trying to use the wrong tool for the particular task at hand. It's easy enough on an analog scope but I have to forgo all the niceties that REW has (which is why I tried to use it for this in the first place). Of course I suppose I could just use REW's oscilloscope and signal generator and do the same determination of what frequency the .707 output level happens at. LOL my workstations are in controlled climate, the analog scope isn't and its a pain to move...
 

John Mulcahy

REW Author
Joined
Apr 3, 2017
Messages
7,357
I'm not clear what scope measurements can tell you that the sweep measurement with a similarly low input signal wouldn't? It would be prudent to do a soundcard calibration to compensate for any DAC reconstruction/ADC antialias filter effects, the 'clean' measurement is showing some source of high end rolloff. At 10 kHz where the 'clean' response peaks a 2.6 kHz HP would still be 0.27 dB down so coming 3 dB down from there wouldn't give you the correct corner frequency anyway. At least the measurement shows you the whole response rather than picking a few points and making an assumption about where it can be considered level.
 

sekim

Registered
Thread Starter
Joined
Mar 23, 2021
Messages
9
The sound card is flat as verified in RMAA and the HF roll off is in the device being tested. The sound card is a decent piece of gear with AK5394 for ADC and CS4398 for DAC, older but still very high spec. But that said, I will do a card calibration just in case since you made it so easy to do and I'll measure again and see what I get.

The analog oscilloscope method is straightforward enough. Just tune the signal generator to view highest amplitude of a relatively clean sine on the scope, then tune it to view .707 of highest amplitude and note the frequency. Of course there are knobs to do that so it only takes a minute or two and is fairly accurate. LOL, I just have to suffer the heat and mosquitoes in the garage or the hassle of hauling all of it inside. Fortunately won't need to measure oddball stuff like the Rangemaster on a regular basis...

BTW, REW completely rocked when I used it for tuning impedance curves on a reactive load box I built, a real game changer.
 

John Mulcahy

REW Author
Joined
Apr 3, 2017
Messages
7,357
The analog oscilloscope method is straightforward enough. Just tune the signal generator to view highest amplitude of a relatively clean sine on the scope, then tune it to view .707 of highest amplitude and note the frequency. Of course there are knobs to do that so it only takes a minute or two and is fairly accurate.
Perhaps I am misunderstanding, it would seem the assumption there is that the highest amplitude corresponds to no attenuation from the HP (it would have to be above about 16 kHz to be past the -0.1 dB point of a 2.6k HP) but if the system also has a high end LP contribution then coming down 3 dB from the peak level isn't going to give the right answer. The peak will have some HP attenuation and some LP attenuation and so won't represent 0 dB hence -3 dB from that attenuated level will not correspond to the HP corner frequency.
 

John Mulcahy

REW Author
Joined
Apr 3, 2017
Messages
7,357
An alternative approach could be to fit a much larger cap than needed, at least 10 times the expected value for 2.6 k, then make a soundcard calibration with that cap and save the cal file. A measurement with that cap and cal file should then be flat. Put back the planned cap and the actual HP frequency it produces should be easy to see.
 

sekim

Registered
Thread Starter
Joined
Mar 23, 2021
Messages
9
Perhaps I am misunderstanding, it would seem the assumption there is that the highest amplitude corresponds to no attenuation from the HP (it would have to be above about 16 kHz to be past the -0.1 dB point of a 2.6k HP) but if the system also has a high end LP contribution then coming down 3 dB from the peak level isn't going to give the right answer. The peak will have some HP attenuation and some LP attenuation and so won't represent 0 dB hence -3 dB from that attenuated level will not correspond to the HP corner frequency.

I saw less HF roll off on the analog scope, not sure why since I know its not the card. I'm thinking it might be that the relatively weak output Z of the Rangemaster with some stray capacitance is forming a low pass, at least that's my theory for now anyway. I scoped it internally, so no cable involved when I did that. But even assuming a tenth or two of a dB true roll off, when I try to see what that is on a plot that's fairly representative, it only amounts to a few Hz. So while mathematically not the right answer, from a practical standpoint it would probably be a real pain to find the exact cap out of a batch to get it that close. I know I can hear ~300Hz difference easy enough (i.e. 2.3KHz vs 2.6KHz), but I'd be pleased as punch if I could build a run of these that all came in within +- 50Hz of bogey. Fortunately my widget production days are long behind me so all I have to do is my own copy :)

An interesting side note on the Rangemaster is it originated in Great Britain in the 1960s and as dirt simple as it is and as relatively unknown as it is to guitar players these days, it is the key sonic component for countless artists and albums not only from that period, but for a couple of decades forward. Its pretty fun to see some of the young guns post on YouTube when they discover this thing (or one of the boutique versions), it opens up a whole new world for them. There have been some consequential guitar pedals over the years and this one is in the top 3 imo. Well, the original was actually a box, but all the variants since then are pedals.
 

sekim

Registered
Thread Starter
Joined
Mar 23, 2021
Messages
9
An alternative approach could be to fit a much larger cap than needed, at least 10 times the expected value for 2.6 k, then make a soundcard calibration with that cap and save the cal file. A measurement with that cap and cal file should then be flat. Put back the planned cap and the actual HP frequency it produces should be easy to see.

I'll try it. Don't even have to remove anything. Just use clip ended jumper wires to parallel in a bigger one, do the cal, unclip and go.
 
Top Bottom