Issue finding settings graphical configuration unwarp phase

Yams

Registered
Thread Starter
Joined
Apr 10, 2023
Messages
3
Hello

I'm a REW new user and I have issues to find the way to configure the graphical part SPL PHASE.

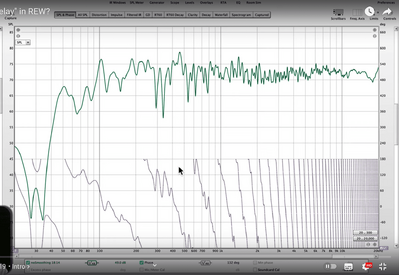
1) I ve seen a vidéo where the phase and frequency response are separate on the graphic (pic 1), i don't find the configuration to do that.
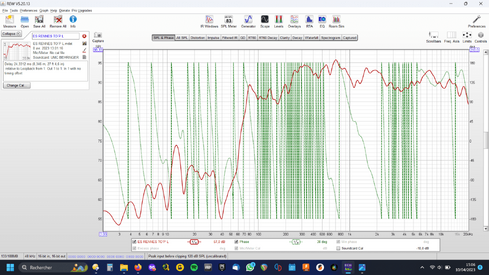
on my REW the phase is in the middle of the frequency (pic 2)

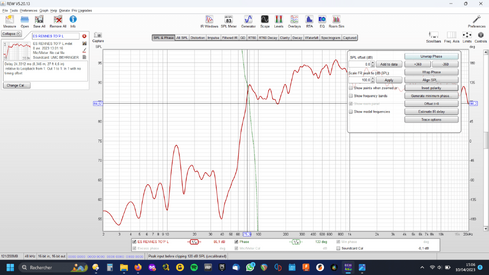
2) when i want to unwarp the phase, REW shows me only the unwarp phase of the frequency selected (pic 3), not all the bandwidth.

Thanks for your help
 

Attachments

  • 1.png
    1.png
    297 KB · Views: 6
  • 2.png
    2.png
    253.3 KB · Views: 6
  • 3.png
    3.png
    125.7 KB · Views: 6

John Mulcahy

REW Author
Joined
Apr 3, 2017
Messages
7,340
You can change the position and range of the phase trace using the scroll bar and zoom buttons on the right hand side of the graph, the zoom buttons are shown when the mouse is over the graph. You can also set the limits for the phase trace in the dialog that is shown when you click the Limits button above the graph. You will rarely be able to see the whole of an unwrapped phase trace since it may span many thousands of degrees if there is any time delay in the response or phase rotations due to the response passing through nulls.
 

Yams

Registered
Thread Starter
Joined
Apr 10, 2023
Messages
3
You can change the position and range of the phase trace using the scroll bar and zoom buttons on the right hand side of the graph, the zoom buttons are shown when the mouse is over the graph. You can also set the limits for the phase trace in the dialog that is shown when you click the Limits button above the graph. You will rarely be able to see the whole of an unwrapped phase trace since it may span many thousands of degrees if there is any time delay in the response or phase rotations due to the response passing through nulls.
thank you so much for your explanation. I succed to put the phase curve as i wanted thanks to you.
The unwarp phase graphics part is more obscure for me. I try to align subs and top and without seeing the evolution of the unwraped phase through frequency domain it's hard to determine the number of phase shifts between speakers and the direction of the delay. In the vidéo I ve seen the REW user seems to succed to have a full vision of the unwarped phase through frequency. Sorry if I havn't fully understood your second part of the answer, I'm trying to improve my system calibration skill but I m still a beginner.
 

John Mulcahy

REW Author
Joined
Apr 3, 2017
Messages
7,340
Your measurement has a lot of phase wraps because the time = zero position of the impulse response is earlier than the actual start of the response, so it includes a time delay. That might be because you used a loopback as a timing reference but didn't apply a timing offset to allow for the time delay from speaker to mic. You can change the t=0 position on the Impulse graph, or change it for multiple responses at the same time on the impulse overlay graph. If you change t=0 individually you should change it by the same amount for all measurements you are trying to align.
 

Yams

Registered
Thread Starter
Joined
Apr 10, 2023
Messages
3
Your measurement has a lot of phase wraps because the time = zero position of the impulse response is earlier than the actual start of the response, so it includes a time delay. That might be because you used a loopback as a timing reference but didn't apply a timing offset to allow for the time delay from speaker to mic. You can change the t=0 position on the Impulse graph, or change it for multiple responses at the same time on the impulse overlay graph. If you change t=0 individually you should change it by the same amount for all measurements you are trying to align.
thank you so much, it's clear now and you are right I didn't apply the distance between mic and speaker.
 
Top Bottom