Is it possible to change later the frequency range a step response is calc ?

user44455555

Registered
Thread Starter
Joined
Jan 16, 2021
Messages
137
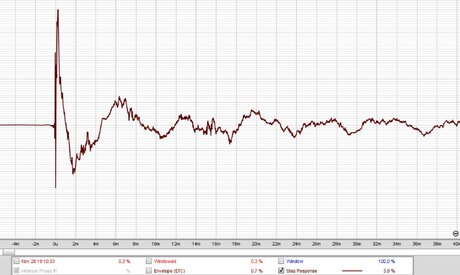
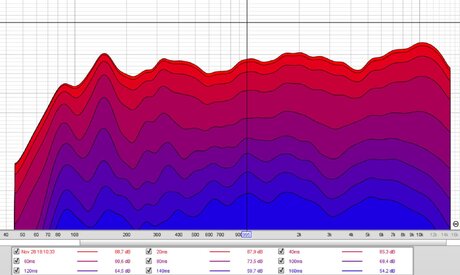
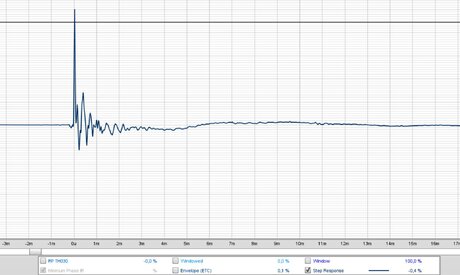
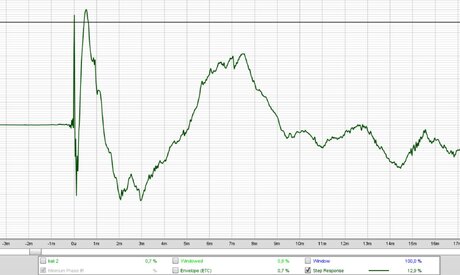
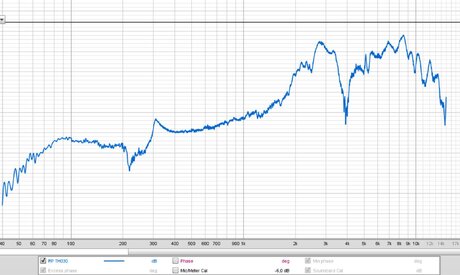
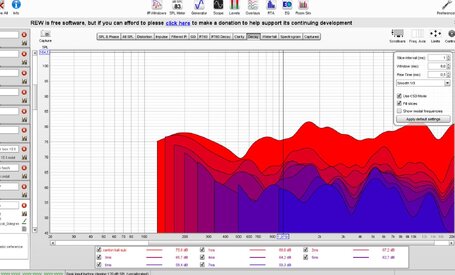
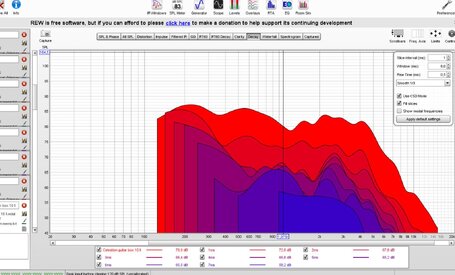
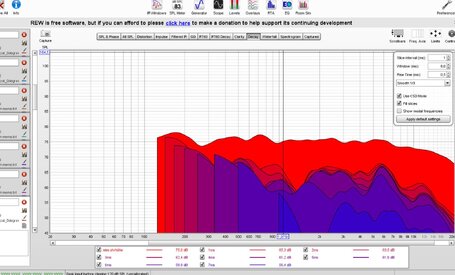
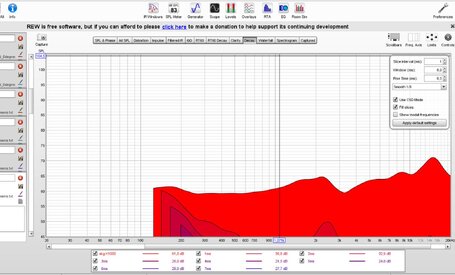
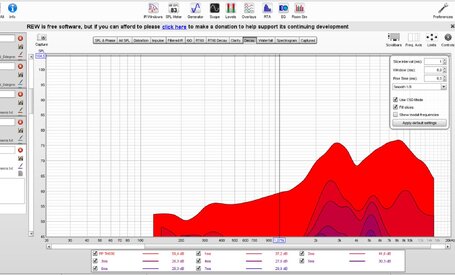
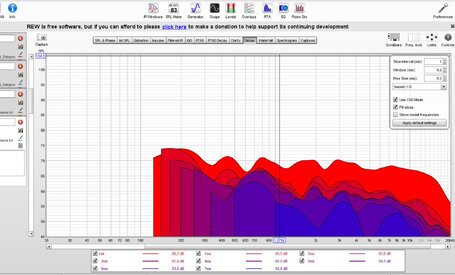
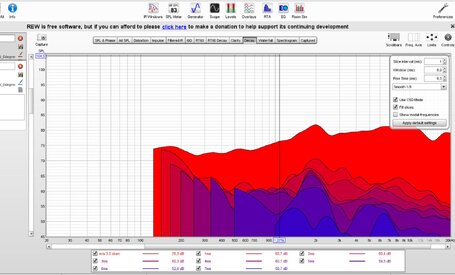
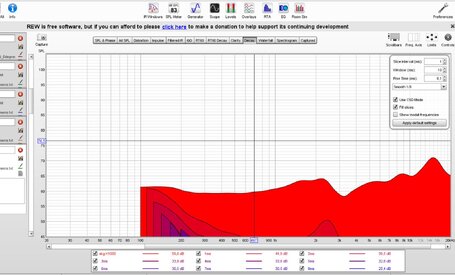
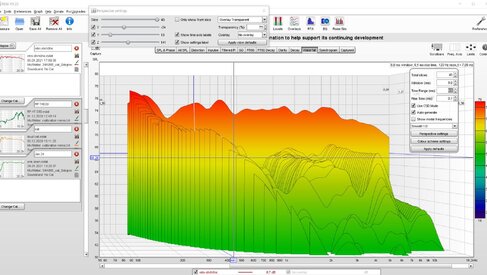
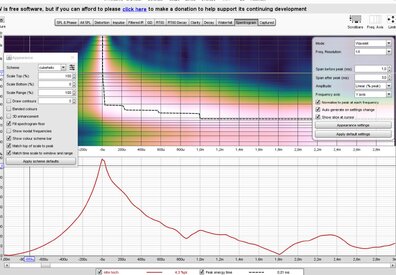
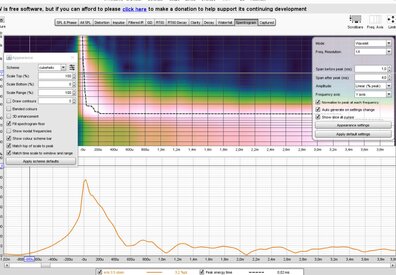
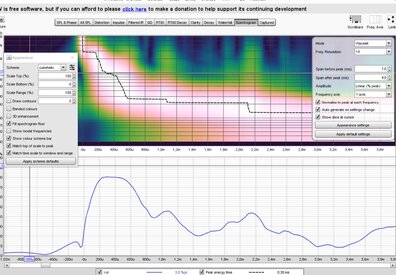
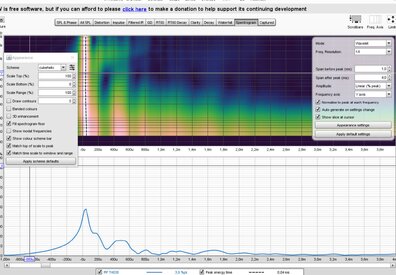
I have measure all speakers 20 hz upto 20 khz. I now wish to show the step response from 150 hz upto 1.5 khz because i read that the step response change of frequency response of the speaker. so i can better compare speakers when show only small range. and what do you think which is best measure method to see the precision of the mid range ?. I see 3.5 inch speakers have much better step response as large 2 way speakers and i hear much more stereo width on 3.5 inch speakers. for binaral heraring mid range precision of a speaker seem important. can read that brain can detect 10-20 microseconds of delay between ears. i do test and i really hear a litte 22.6 microseconds delay but i hear not tones with 50 microseconds period.

The auditory system encodes the timing of peaks in basilar-membrane motion with exquisite precision, and perceptual models of binaural processing indicate that the limit of temporal resolution in humans is as little as 10-20 microseconds. In these binaural studies, pairs of continuous sounds with microsecond differences are presented simultaneously, one sound to each ear. In this paper, a monaural masking experiment is described in which pairs of continuous sounds with microsecond time differences were combined and presented to both ears. The stimuli were matched in terms of the excitation patterns they produced, and a perceptual model of monaural processing indicates that the limit of temporal resolution in this case is similar to that in the binaural system.
 

John Mulcahy

REW Author
Joined
Apr 3, 2017
Messages
7,212
Step response does not have a frequency range, it is the integral of the impulse response.
 

user44455555

Registered
Thread Starter
Joined
Jan 16, 2021
Messages
137
then I mean if the impiulse response can have a frequency range later for processing the impulse response out of the measure tones from 150-1.5 khz for examples ?.
 

EarlK

Member
Joined
May 22, 2017
Messages
221
then I mean if the impiulse response can have a frequency range later for processing the impulse response out of the measure tones from 150-1.5 khz for examples ?.

That's a fairly incoherent sentence ( from this side of the screen ). ;)

Frequency Response is derived from the captured impulse response.

If you previously had REW capture/create a full-range impulse ( say 20hz - 20Khz ) then you are free to only look at just a portion of the initial capture ( with no data accuracy penalties applied ).

:)
 

user44455555

Registered
Thread Starter
Joined
Jan 16, 2021
Messages
137
If you previously had REW capture/create a full-range impulse ( say 20hz - 20Khz ) then you are free to only look at just a portion of the initial capture ( with no data accuracy penalties applied ).

and how can do this with the impulse or step response in REW ? . he suggest a cumulative spectral decay. but i see not this feature in REW. i think show a step response from the range of 150-1.5 khz is enough to see good mid speakers precision and need no cumulative spectral decay. but i wish not all measure again with 150-1.5 khz


in this post stand

Only if the frequency transmission ranges of the chassis are completely identical, one could read off conclusions about the decay behavior of the chassis. This is unlikely to be the case in reality when comparing loudspeakers.

In order to be able to make a statement about the decay behavior of a loudspeaker (to get a "value if a speaker is precise"), the measured impulse response is converted into the cumulative spectral decay (with time-based or oscillation-based axis).
In this way, it is much easier to make statements about the decay behavior of loudspeakers - provided that reflections are suppressed via gate.
 

John Mulcahy

REW Author
Joined
Apr 3, 2017
Messages
7,212
The behaviour of a system is captured in its impulse response. Capturing it accurately requires a stimulus that spans the entire bandwidth of the system. Your 20 Hz to 20 kHz measurements are probably sufficient for that, though maximum information would be extracted by measuring with a range from zero to half the sample rate.

Once the impulse response has been obtained the behaviour of the system can be examined through other perspectives, such as the frequency response, or combined time and frequency views like the waterfall, spectral decay or spectrogram plots. It is not necessary or even meaningful to talk of remeasuring over particular frequency spans.
 

user44455555

Registered
Thread Starter
Joined
Jan 16, 2021
Messages
137
and what display method do you suggest to look if a mid range speaker is precise and fast ?. in the spectral decay i see from 0 to 20 ms only very few is reduce at around 1 khz. but in step response i see its faster. rew 2 is the 3.5 inch speaker. rew 3 is 6.5 inch and look much slower and sound worse. in the decay see no diffrence. rew 4 is step response of a headphone on a table and microphone 0,5 cm near. in compare to headphone the speakers are exfreme worse . rew 5 is frequency response of the headphone.
 

Attachments

  • REW 2.jpg
    REW 2.jpg
    188.3 KB · Views: 12
  • REW 1.jpg
    REW 1.jpg
    138.5 KB · Views: 12
  • rew 4.jpg
    rew 4.jpg
    176.3 KB · Views: 16
  • rew 3.jpg
    rew 3.jpg
    185.3 KB · Views: 15
  • rew 5.jpg
    rew 5.jpg
    169.1 KB · Views: 10
Last edited:

John Mulcahy

REW Author
Joined
Apr 3, 2017
Messages
7,212
What is "fast" supposed to mean? A driver that has poor low frequency extension will have a shorter impulse response than one with better low frequency response. That doesn't make it better or worse, it just means it covers a different range. In choosing a driver you are probably best looking at the frequency response and distortion over the frequency range and SPL within which you intend to operate it, though many other factors will also be relevant.
 

user44455555

Registered
Thread Starter
Joined
Jan 16, 2021
Messages
137
fast is what ears can hear. so if 10-20 microseconds delay can hear between left and right ears, the mid range speaker that do from 150 hz -1.5 khz look too worse when he need 1 ms to reach 0 when ears are able for correct binaural detection 20 microseconds. see compare to headphones impulse. do you think it is better to do new measuruments and measure only from 800 hz to 1.2 khz and show step response from this to get better comparable values so that no one complains ?

maybe other read in that thread can hear too. attach are 2 records. one have less stereo width. which version have the more stereo wide and sound as in a larger room ?. best hear on headphones.
the REW 2.jpg in my measure have in FR measure better low frequency and faster step response
 

Attachments

  • width 3.zip
    309.1 KB · Views: 5
  • width 4.zip
    309.9 KB · Views: 2

John Mulcahy

REW Author
Joined
Apr 3, 2017
Messages
7,212
Your statements do not make sense.

do you think it is better to do new measuruments and measure only from 800 hz to 1.2 khz and show step response from this
No, absolutely not, that is probably the worst thing you could do. I will make one final attempt to explain. The behaviour of a device can be captured in its impulse response. There are various ways to determine the impulse response, one of the best methods is to use a logarithmically swept sine signal that starts at a frequency below the lowest frequency the device can respond to and ends at a frequency above the highest frequency the device can respond to. That is what REW uses. That sweep should span a range greater than the frequency range of the device, if you restrict the range of the measurement sweep you will not capture the true impulse response of the device. Once the impulse response has been obtained it can be used to show the response of the device to any signal. The various graphs in REW provide different ways of viewing the response of the device.

The performance requirements of a mid range driver have nothing whatsoever to do with the inter-aural time delay (ITD) discrimination limits of our ears. ITD is one of the factors used to determine source direction and depends on the angle of the source, not the characteristics of the source.

For a driver to have a step response rise time of 10 us it would need a 3 dB bandwidth of approximately 35 kHz. Do you not see how nonsensical it is to talk about a mid range driver in effect needing a 35 kHz bandwidth?
 

user44455555

Registered
Thread Starter
Joined
Jan 16, 2021
Messages
137
this show tests in the medicine studie. see link in 1. post. to verify try yourself with a delay of 22 microseconds in right channel. this can hear. Because binaural hearing in delay go only upto 1.5 khz depend on delay(at higher freq it is depend more on levels between left and right ears), so to produce correct need a mid range speaker too that is precise (3 way system for examples or small speakers). When a mid range speaker is not precise it can not produce correct signal in delay because of wobbling membran. I can hear in real world or on headphones more precise stereo position as on large 2 way speakers. also the small 2 way speakers are not good as headphones or real. 3 way speaker i have not hear
 

user44455555

Registered
Thread Starter
Joined
Jan 16, 2021
Messages
137
I find REW deacy settings that show more and can choose a frequency and see db values. but better is when can change slice interval ms to 0.5 ms. is this possible to change ?. currently smallest slice intervall is 1 ms. see the screenshots of big, small speaker and headphone in compare. when steps can be 0.5 can be much better compare. or maybe the db loss in compare to highest signal can maybe show in %. then it is better comparable. because the speakers headphones are at same frequency diffrent loud.
 

Attachments

  • canton kali as sub.jpg
    canton kali as sub.jpg
    194.3 KB · Views: 9
  • Celestion Guitar box 10 inch greenbag.jpg
    Celestion Guitar box 10 inch greenbag.jpg
    193.9 KB · Views: 15
  • iloud mtm.jpg
    iloud mtm.jpg
    190.9 KB · Views: 13
  • AKG K1000 headphone.jpg
    AKG K1000 headphone.jpg
    181.5 KB · Views: 11
  • Panasonic RP TH030 Headphone.jpg
    Panasonic RP TH030 Headphone.jpg
    184.6 KB · Views: 10
  • Kali LP6.jpg
    Kali LP6.jpg
    187.9 KB · Views: 9
  • Presonus eris 3.5.jpg
    Presonus eris 3.5.jpg
    176.8 KB · Views: 11
  • AKG K1000.jpg
    AKG K1000.jpg
    180.5 KB · Views: 10
Last edited:

user44455555

Registered
Thread Starter
Joined
Jan 16, 2021
Messages
137
the waterfall diagram look strange when i do time range 8 ms. see screenshot. but when do time range 1,7 ms the curve is gone and look better. another problem with waterfall how can get the db value of 1 ms ?. i think when click in diagram you get only the value of the end of time range, for example when i set to 1.7 i get at 1,7 ms at 1 khz. or when set time range to 8 ms i get the db value at 8 ms at the freq i click.
 

Attachments

  • eris 3.5.jpg
    eris 3.5.jpg
    190.2 KB · Views: 10
  • headphone rpth 030.jpg
    headphone rpth 030.jpg
    200.2 KB · Views: 8
  • kali.jpg
    kali.jpg
    186.8 KB · Views: 14
  • time range 8 ms.jpg
    time range 8 ms.jpg
    197.4 KB · Views: 9

John Mulcahy

REW Author
Joined
Apr 3, 2017
Messages
7,212
the waterfall diagram look strange when i do time range 8 ms. see screenshot
That is how CSD operates, from the help:

In addition to the standard waterfall mode, which slides the window along the impulse response, there is a CSD (Cumulative Spectral Decay) mode, which anchors the right hand end of the window at a fixed point and only moves the left side, which may be useful when examining cabinet or tweeter resonances over very short time spans if the IR data descends into the noise floor soon after the region being examined. Using CSD mode in those cases prevents the later slices from including increasing amounts of noise floor. This does mean, however, that the frequency resolution reduces (and the lowest frequency that can be generated increases) as the slices progress, as each has a slightly shorter total window width than the previous slice. Note also that it does not make sense to have a time range greater than the window width in CSD mode as the window, with its fixed right hand edge, reaches zero width after stepping along by a time interval equal to the window width and there will be no data for subsequent slices. In CSD mode window width should be greater than the time range. CSD mode is often not required for measurements that have good signal to noise ratio, not using it allows frequency resolution to be maintained throughout the time range of interest.

Use the Slice slider in the Perspective settings to change which slice is at the front.
 

user44455555

Registered
Thread Starter
Joined
Jan 16, 2021
Messages
137
I have now test the spectrum. i think this is best when show slice at cursor is enable and normalize to peak at each frequency. only the show slice display is not scale. see headphone result to other results. how can the peak in the below display noramlize to 100% too ?
 

Attachments

  • mtm spectrogram.jpg
    mtm spectrogram.jpg
    251.4 KB · Views: 10
  • eris 3.5 spectrogram.jpg
    eris 3.5 spectrogram.jpg
    254.6 KB · Views: 12
  • kali lp6 spektrogram.jpg
    kali lp6 spektrogram.jpg
    261 KB · Views: 13
  • headphone spectrogram.jpg
    headphone spectrogram.jpg
    247.3 KB · Views: 13

user44455555

Registered
Thread Starter
Joined
Jan 16, 2021
Messages
137
I use 1/1 in above measure. when use 1/6 in freq resoltion the impulse look wrong for headphone and all impulses look near same. but hear lots diffrence between kali and the small speakers with faster impulse.
headphone 1-6 spectrum.jpg
 

John Mulcahy

REW Author
Joined
Apr 3, 2017
Messages
7,212
All time-frequency plots have a trade-off between time and frequency resolution, greater frequency resolution means lower time resolution and vice versa.
 

user44455555

Registered
Thread Starter
Joined
Jan 16, 2021
Messages
137
That's a bug, I'll fix it for the next build.

yes thanks, now it work ok. I only find a small bug when press and hold mouse button and move to top when a measure go only upto 15 khz. the 14.1 khz give a error. see screenshot. but java is really great, i can click on close and can continue to work. on native computer program no reason show wy it crash and need restart program.
 

Attachments

  • array index out of bounds.jpg
    array index out of bounds.jpg
    203.3 KB · Views: 12
Top Bottom