Interpreting RT60 Graph

Trdat

Member
Thread Starter
Joined
Nov 6, 2019
Messages
186
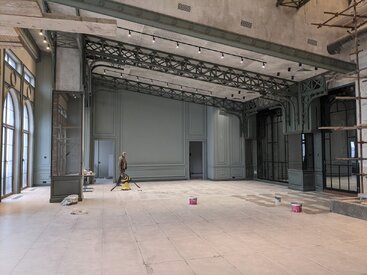
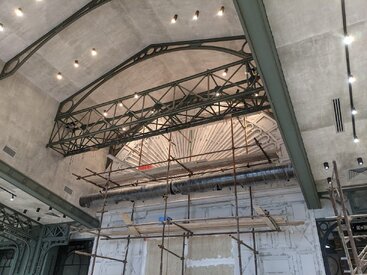
This was taken in a large venue 23m left to right and 17m from front to back, with a vaulted cieling that rises to the rear up to 9m in the middle at its highest part at the back although the side cielings(on teh left and right of the middle) starts from 3m and ends up about 5m, still overall about 3000m3 hall. The back wall is all glass so I suspect the bass just travels passed it and the celiing is a drywall with 60cm to the above concrete ceiling which will act in some way as some membrane or resonant absobrer so I did expect that the bass RT60 would be relatively decent.

I just want to firstly check if the graph is correct? There was no anomolies in the frequency graph and I did estimate 4 to 6 sec but the T20 and T30 are really weird as they end up at 0ms at the middle frequencies so I just want to make sure that the measurement looks correct.

My second question is what do I use to figure out what targeted absorbtion is needed? Meaning, if I want to get down to 1.5 sec which RT60 do I use? As Topt already has 60hz around 1.8 sec so I will not need to absorb too much at that frequency of course this is obvious. Anyway, is Topt the what I am looking at?

I'll admit that I haven't quit yet understood T20 or T30 or Topt for that matter and only realised that the filtered ETC gives a an average of the RT60 but I just need a simple way to know what graph I use to base my targeted absorbtion when I use a online calculator to figure out how much absorbtion I need. I want to fill out the RT60 on the calculator and need to know which RT60 graph to use.

48317
 

DanDan

Moderator
Staff member
Joined
Mar 10, 2018
Messages
749
Use Topt or T30. T20 is the slope of the first 20dB of decay. This slope can level off considerably as the later reverb kicks in.
 

Trdat

Member
Thread Starter
Joined
Nov 6, 2019
Messages
186
Use Topt or T30. T20 is the slope of the first 20dB of decay. This slope can level off considerably as the later reverb kicks in.

Okay I'll use Topt. But the T30 also has considerably dropped off from 100hz to 1500hz what does that mean?
 

DanDan

Moderator
Staff member
Joined
Mar 10, 2018
Messages
749
It is self explanatory data. If T30 and Topt differ much or to get better data on the whole room I suggest measuring at multiple locations. I just noticed the term online calculator. Probably a better plan to install absorption at strategic locations, and observe the improvements.
 

Trdat

Member
Thread Starter
Joined
Nov 6, 2019
Messages
186
It is self explanatory data. If T30 and Topt differ much or to get better data on the whole room I suggest measuring at multiple locations. I just noticed the term online calculator. Probably a better plan to install absorption at strategic locations, and observe the improvements.

I measured multiple times throughout the hall with left and right together and seperately with varying sweeps and all the RT60 times are similar with the Topt averaging between 2 and 4 sec(just like the above graph attached) and the T30 dropping off from about 100hz and then rising around 1k similar to the graph above and at times(with a few measuremnts) some sporadic increases in between and then leveling out after 2k again like the above.


I will be designing a slatted wall behind the stage and on the back wall and then I will measure again, so I will take it as it comes, just really curious what to make of the sudden drop in the T30? Especially if they are in every measurement.
 

DanDan

Moderator
Staff member
Joined
Mar 10, 2018
Messages
749
I just put on glasses and see your graph a bit better. Hmmm. Can you post the .mdat? Reverb measurements, particularly third octave ones used in Building Acoustics, often have a 'confidence' figure. Such figures would warn of invalid data.
You could probably try to 'tune' your slat arrangement around 300Hz. The lack of LF is probably as you said, big area of glass LF absorption.
 

John Mulcahy

REW Author
Joined
Apr 3, 2017
Messages
7,344
Zero decay figures are where there wasn't enough decay span to produce a result per the requirements of the metric, so less than 30 dB for T30 or less than 20 dB for T20 (below the -5 dB point in both cases). Topt is more flexible so more likely to give a result. Given the size of the space you should make sure enough of the IR is being retained, see the Analysis preferences and make sure the IR truncation setting is at least 4.4 seconds. The default is 1.7 seconds, which is suitable for domestically-sized spaces.
 

Trdat

Member
Thread Starter
Joined
Nov 6, 2019
Messages
186
I just put on glasses and see your graph a bit better. Hmmm. Can you post the .mdat? Reverb measurements, particularly third octave ones used in Building Acoustics, often have a 'confidence' figure. Such figures would warn of invalid data.
You could probably try to 'tune' your slat arrangement around 300Hz. The lack of LF is probably as you said, big area of glass LF absorption.

I will be doing exactly that on the front wall with slats its a small portion of the bottom part of the wall near the stage but I think it will be worth the effort(the designers are hesitant to change it) and on the back wall there is two small areas of about 50m square next to the glass, I will also add some absorbtion with a binary template which would diffuse the sound back directly on the dance floor. The wall is positioned in a pretty decent place right behind the dance floor but not too close, at least 4 metres behind.

Then, I would have the opportunity to test again and even if I do have a faulty measurement I don't think it will impede anything. I did want to be sure about the low frequency problem that way I can fight for deeper absorbtion at these two points but my gut feeling is that due to the glass rear wall and the drywall ceiling the low freuquency must be controlled in some way and it wont matter so much if the depth is 25 or 40cm.

I can't imagine a massive reduction from only those two points of coverage but I will continue to treat the entire hall as I go, portion by portion.

Understanding and interpreting measurements has to be the most difficult part.
 

Attachments

  • PXL_20211126_093515220.jpg
    PXL_20211126_093515220.jpg
    173.2 KB · Views: 22
  • PXL_20211126_093504344.jpg
    PXL_20211126_093504344.jpg
    206.3 KB · Views: 22
  • PXL_20211126_093559328.MP.jpg
    PXL_20211126_093559328.MP.jpg
    183.9 KB · Views: 20
Last edited:

Trdat

Member
Thread Starter
Joined
Nov 6, 2019
Messages
186
Zero decay figures are where there wasn't enough decay span to produce a result per the requirements of the metric, so less than 30 dB for T30 or less than 20 dB for T20 (below the -5 dB point in both cases). Topt is more flexible so more likely to give a result. Given the size of the space you should make sure enough of the IR is being retained, see the Analysis preferences and make sure the IR truncation setting is at least 4.4 seconds. The default is 1.7 seconds, which is suitable for domestically-sized spaces.

You did mention this in the other thread and I absolutely forgot to change the truncation, . How innacurrate can my measurement be if I left it at the default?

Can the Topt reading be enough to get an idea or would it be totally off...?
 

Trdat

Member
Thread Starter
Joined
Nov 6, 2019
Messages
186
After REW has made a measurement it can truncate the derived impulse response to preserve the important information while minimising the storage required for the measurement file. A 1 second period is retained before the peak, and by default a 1.7 second period is retained after the peak (this varies a little depending on the sample rate, at 44.1k (or multiples) it is approx 2 seconds, at 48k 1.7 seconds). In some cases it may be useful to retain more of the impulse response, such as measurements in very large spaces which have very long impulse responses. REW provides options to truncate the response after approx 4.4 seconds, or 9.9 seconds, or to retain the entire impulse response. It may also be necessary to use a longer sweep (with a 256k sweep there is about 6 seconds of impulse response data available after the peak). Note that retaining the entire impulse response will produce much larger measurement files, especially if long measurement sweeps are used. If the entire response is retained the peak will be centred within the response.

Most of this is totally beyond me, but my basic understanding is that the default setting will not effect the accuracy of the measurement but more so not retinaining the entire response. I noticed this in the spectrogram which stops at 1sec, the impulse response stops at 1.7 sec and the RT60 stops at 10k. Have I understood this correctly?

If so then it seems that my measurements are fairly accurate or at least enough to get an idea of what is going on.

Zero decay figures are where there wasn't enough decay span to produce a result per the requirements of the metric, so less than 30 dB for T30 or less than 20 dB for T20 (below the -5 dB point in both cases). Topt is more flexible so more likely to give a result. Given the size of the space you should make sure enough of the IR is being retained, see the Analysis preferences and make sure the IR truncation setting is at least 4.4 seconds. The default is 1.7 seconds, which is suitable for domestically-sized spaces.

It's just in your paragraph you have connected changing the defualt setting of the truncation to the zero figure in the RT60 for T30, so does the default truncation effect the T30 metric like it did in my graph? Or are they two seperate things...?
 

John Mulcahy

REW Author
Joined
Apr 3, 2017
Messages
7,344
RT60 estimation uses the decay of the Schroeder integral, which is derived from the impulse response. For T20 it uses the part from -5 dB to -25 dB. For T30 it uses the part from -5 to -35 dB. If the decay is long and the impulse is truncated after 1.7 seconds the level may never get down to -25 dB or -35 dB in some bands. In those cases there will be no decay value and a zero on the graph and in the results table. Topt can make an estimate using what decay there is, but the accuracy may be poor if there isn't much response to work with.
 

DanDan

Moderator
Staff member
Joined
Mar 10, 2018
Messages
749
Tx John, sometimes I speak a bit too loosely. And EDT is derived from 0dB to -10dB. In REW is the truncation applied during the measurement or can it be extended afterwards for a better view?
 
Top Bottom