Marius1987
Registered
Thread Starter
- Joined
- Dec 15, 2023
- Posts
- 1
Hello
I'm trying to identify a problem on my impedance measurement.
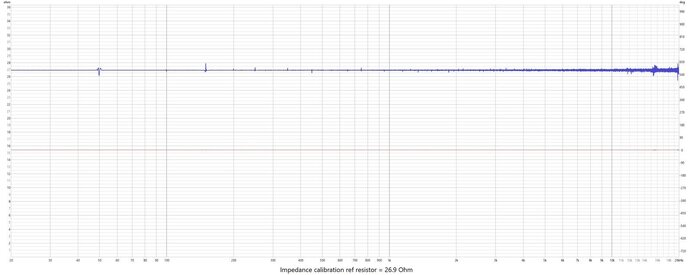
I'm using the onboard Realtek sound card on my desktop computer and I also have an amplifier hooked up. I'm using a jig with a 10 Ohm sense resistor and voltage divider.
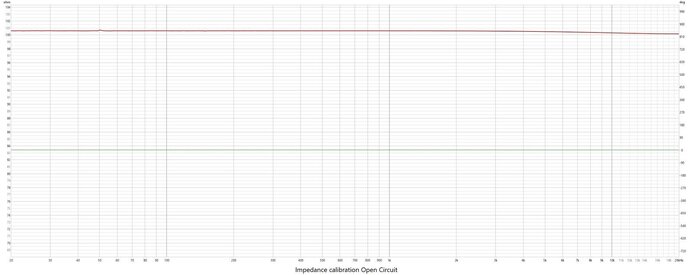
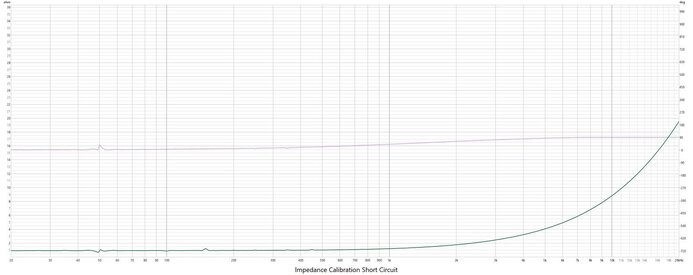
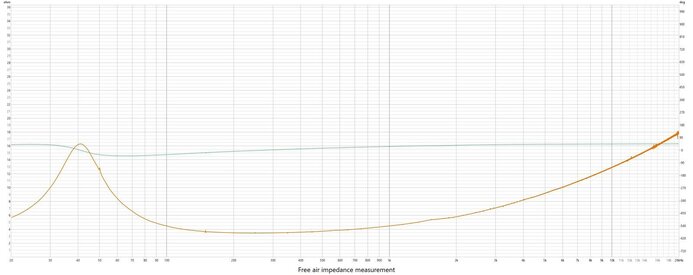
I attached the images with each of the calibration steps and an impedance measurement of the speaker. Mdat file included also.
The problem is that I get this weird spikes in multipliers of 50 Hz. I have an external Asus sound card which exhibits the same behavior. If I increase the amp volume, the spikes become smaller and smaller to the point they are not noticeable. By the time the graph is smooth, the voltage at the speaker terminals is 800+ mV. If I keep the voltage down to 150-250 mv, the TS parameters pretty much match the ones I get from measuring with DATS. Even though I have the spikes on the graph.
If I take out the amp from the equation and use a sense resistor of 100 Ohm and just rely on the headphone output, the graph is smooth, but the voltage at the speaker terminals is less than 20 mV.
If anyone can give me an explanation of what's happening I would be most grateful. The only connection I am making is that 50 Hz is the frequency of the power outlet (EU standard). Somehow it corrupts my measurement. Don't really know. I tried separating the signal wires from the power wires as much as I could with no success. Maybe it's something wrong with my measurement jig.
Any ideas?
Thanks
I'm trying to identify a problem on my impedance measurement.
I'm using the onboard Realtek sound card on my desktop computer and I also have an amplifier hooked up. I'm using a jig with a 10 Ohm sense resistor and voltage divider.
I attached the images with each of the calibration steps and an impedance measurement of the speaker. Mdat file included also.
The problem is that I get this weird spikes in multipliers of 50 Hz. I have an external Asus sound card which exhibits the same behavior. If I increase the amp volume, the spikes become smaller and smaller to the point they are not noticeable. By the time the graph is smooth, the voltage at the speaker terminals is 800+ mV. If I keep the voltage down to 150-250 mv, the TS parameters pretty much match the ones I get from measuring with DATS. Even though I have the spikes on the graph.
If I take out the amp from the equation and use a sense resistor of 100 Ohm and just rely on the headphone output, the graph is smooth, but the voltage at the speaker terminals is less than 20 mV.
If anyone can give me an explanation of what's happening I would be most grateful. The only connection I am making is that 50 Hz is the frequency of the power outlet (EU standard). Somehow it corrupts my measurement. Don't really know. I tried separating the signal wires from the power wires as much as I could with no success. Maybe it's something wrong with my measurement jig.
Any ideas?
Thanks